Help us predict the future: introducing OpenSight Ripple


What happens to the markets when a frontier AI lab cannot pay its compute bills? Or when a surprise open-weights model undercuts the labs? Or when chip export controls tighten? We do not know, and neither does anyone else. But we can write down how we think the pieces connect, let a simulation compute what follows, and let everyone argue with the result. That is OpenSight Ripple: a public, probabilistic market cause-and-effect graph, live in beta at opensight.ch/ripple. It is only as good as the relationships in it, and that is where we need you. Open Ripple, go to Contribute and tell us which cause-and-effect link we are missing or have wrong.
TL;DR
- Ripple maps how developments in IT, AI, politics and finance ripple through markets, and computes how likely the first-, second- and third-order effects are.
- It is a graph plus a simulation. AI helps you ask questions and extend the graph, but it never does the maths.
- You can explore the graph, ask questions, simulate events, filter by country, contribute relationships of your own, and share a result as a fixed snapshot link.
- Every probability is a model estimate, and every one of the 150 links in the graph is currently an assumption. We would like your evidence, your corrections and your own scenarios.
Contents
- What OpenSight Ripple is, and why we built it
- How Ripple works
- Explore the market cause-and-effect graph
- Ask a question
- Simulate a market scenario
- Switch the country
- Contribute a relationship
- Share a result
- A worked AI bubble scenario: a lab that cannot pay
- Help us predict the future
What OpenSight Ripple is, and why we built it
Most market commentary follows one development at a time: a new model, a rate decision, a chip shortage. The interesting part is what happens next, and what that sets off in turn. A cheap open-weights model changes what the labs can charge, which changes how investors value them, which changes how much data-centre capacity gets built. Nobody holds that whole chain in their head, and a spreadsheet does not either.
Ripple holds it in a graph. Each node is an event, such as "AI agents halve development costs" or "Credit stress in AI infrastructure". Each link says how likely one event is to set off another. A simulation then computes how likely every event becomes in a given scenario, including the second-order effects, two and three steps away, that you would not think to ask about. The graph spans IT, AI, politics and finance, and in version 133 it holds 65 factors and 150 links over a horizon of 2026 to 2030.
Ripple is not a prediction market: nobody bets on it, and its probabilities come from a model of causes and effects, not from prices.
We built it because we wanted to reason about this out loud and in public, with numbers that can be challenged, rather than as a feeling. We build the graph from curated research and from your contributions, and we are connecting it to news, market and job data.
How Ripple works
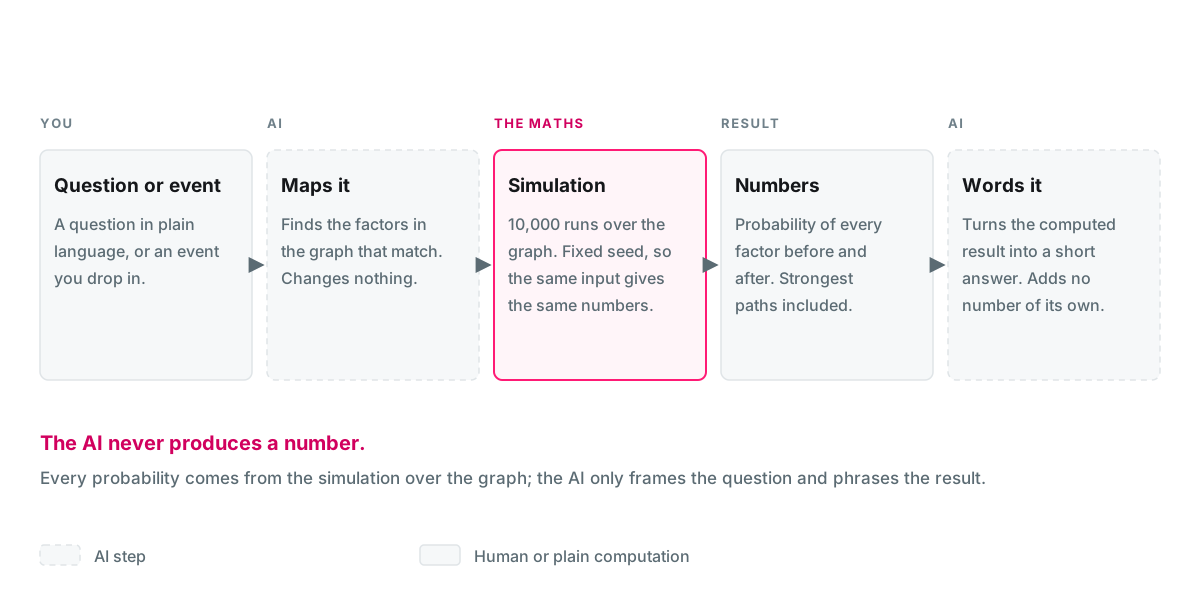
Every factor is a yes-or-no event with a base rate: how likely it is within the horizon without any modelled cause. Every link has a strength, the chance that the effect fires when the cause occurs, a polarity, because some links suppress instead of amplify, and a delay in quarters. A simulation runs the whole graph 10,000 times with a fixed seed. Causes combine as a noisy OR, and root causes are drawn once per run so that a common cause is never counted twice.
Because the seed is fixed, the same graph version gives the same numbers every time. The AI has two jobs, both at the edges: it maps your free-text question to the matching factors, and it words the result. It never produces a number, and it never changes the graph. It is the same stance we take with our own agents: the model proposes, a deterministic layer decides, and a human stays in the loop. We wrote about that in Do We Have AI Under Control?.
Explore the market cause-and-effect graph
Open the page and you see the whole graph. Each node shows its probability by the end of 2030, and the colour of the node says how likely it is: the stronger the pink, the more likely. Click a factor to open its causes and effects, in order from drivers to first-, second- and third-order effects.
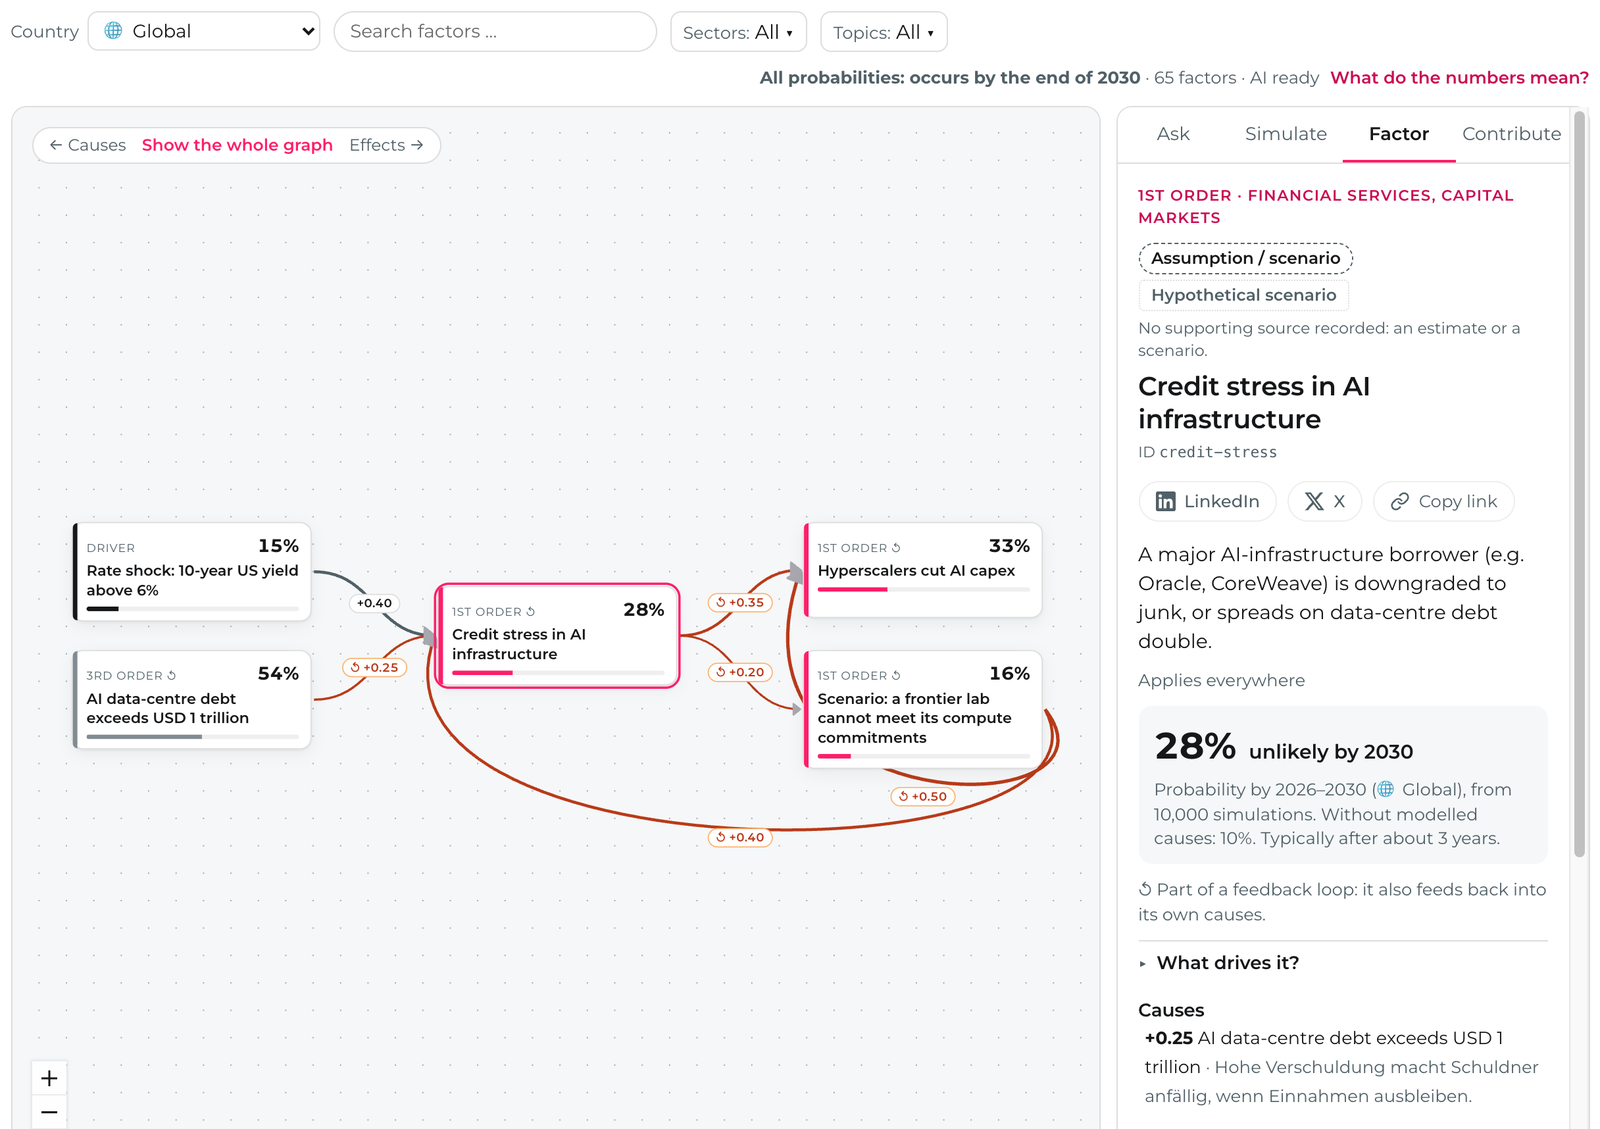
Three things in that view are worth knowing about:
- Evidence. Each factor carries a label for what its number rests on: an assumption or scenario, backed by news, or backed by data or research. In version 133, 13 of the 65 factors are backed by data or research, 12 by news, and 40 are assumptions. Where a source contradicts a factor, it is marked as contested.
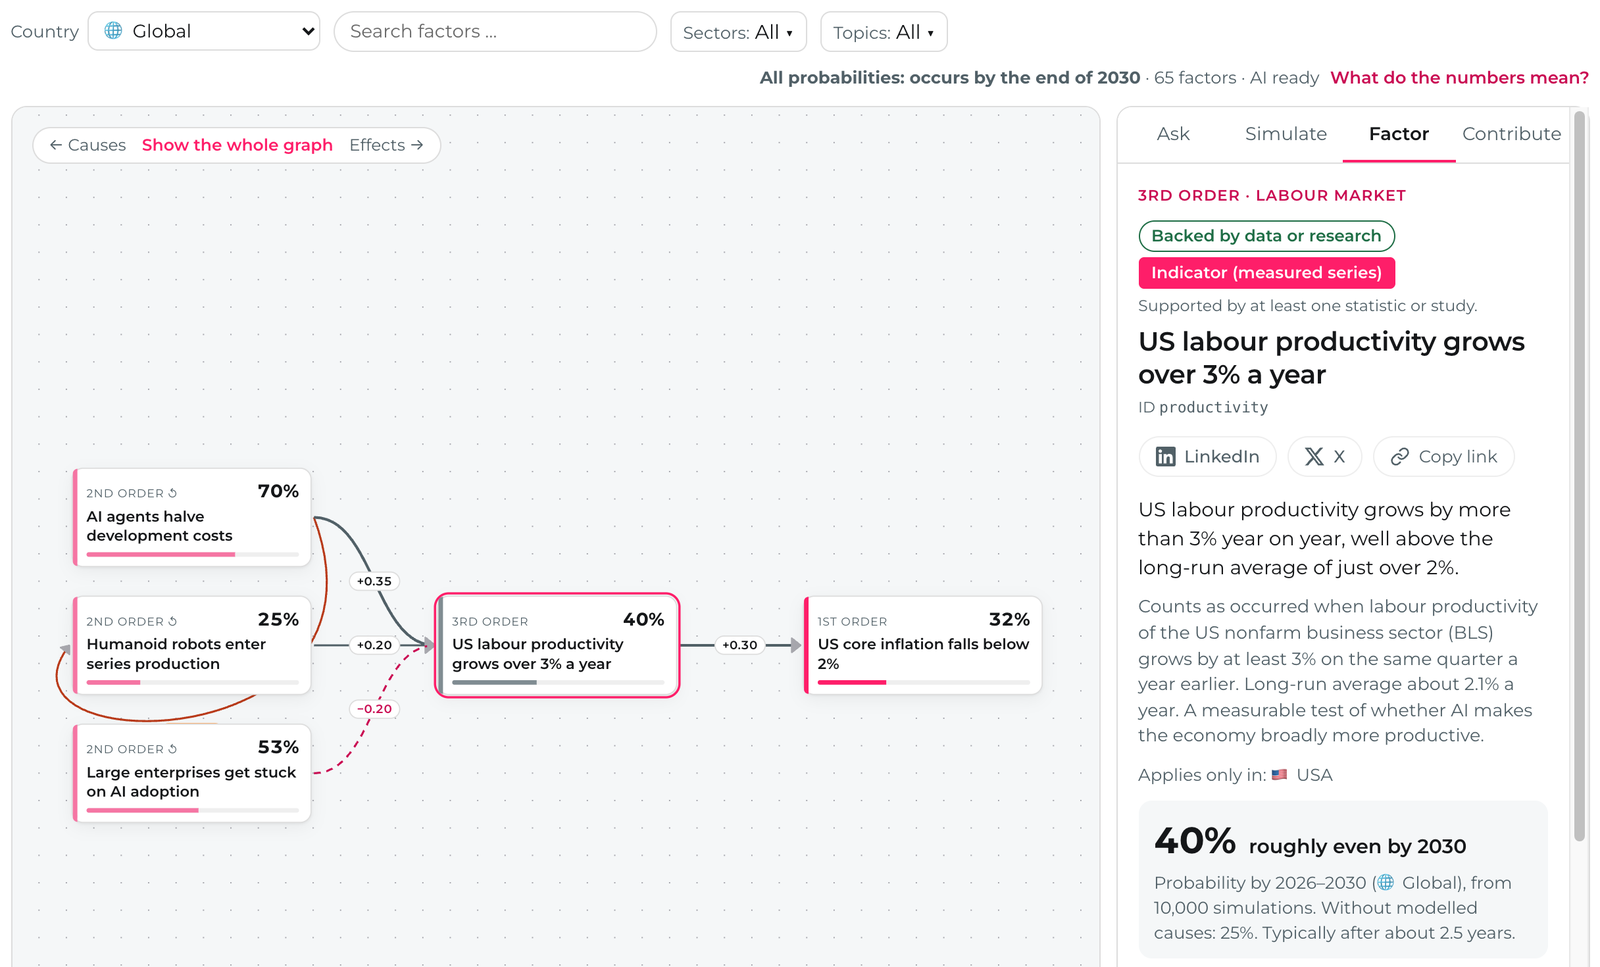
- Indicators. Eight factors are indicators: they have a measured series behind them and a threshold at which they count as occurred, for example US labour productivity growing by more than 3% a year.
- Feedback loops. Markets feed back into themselves. 34 factors in the graph sit on a loop, which the view marks, because a loop can bring an event forward or hold it back.
Ask a question
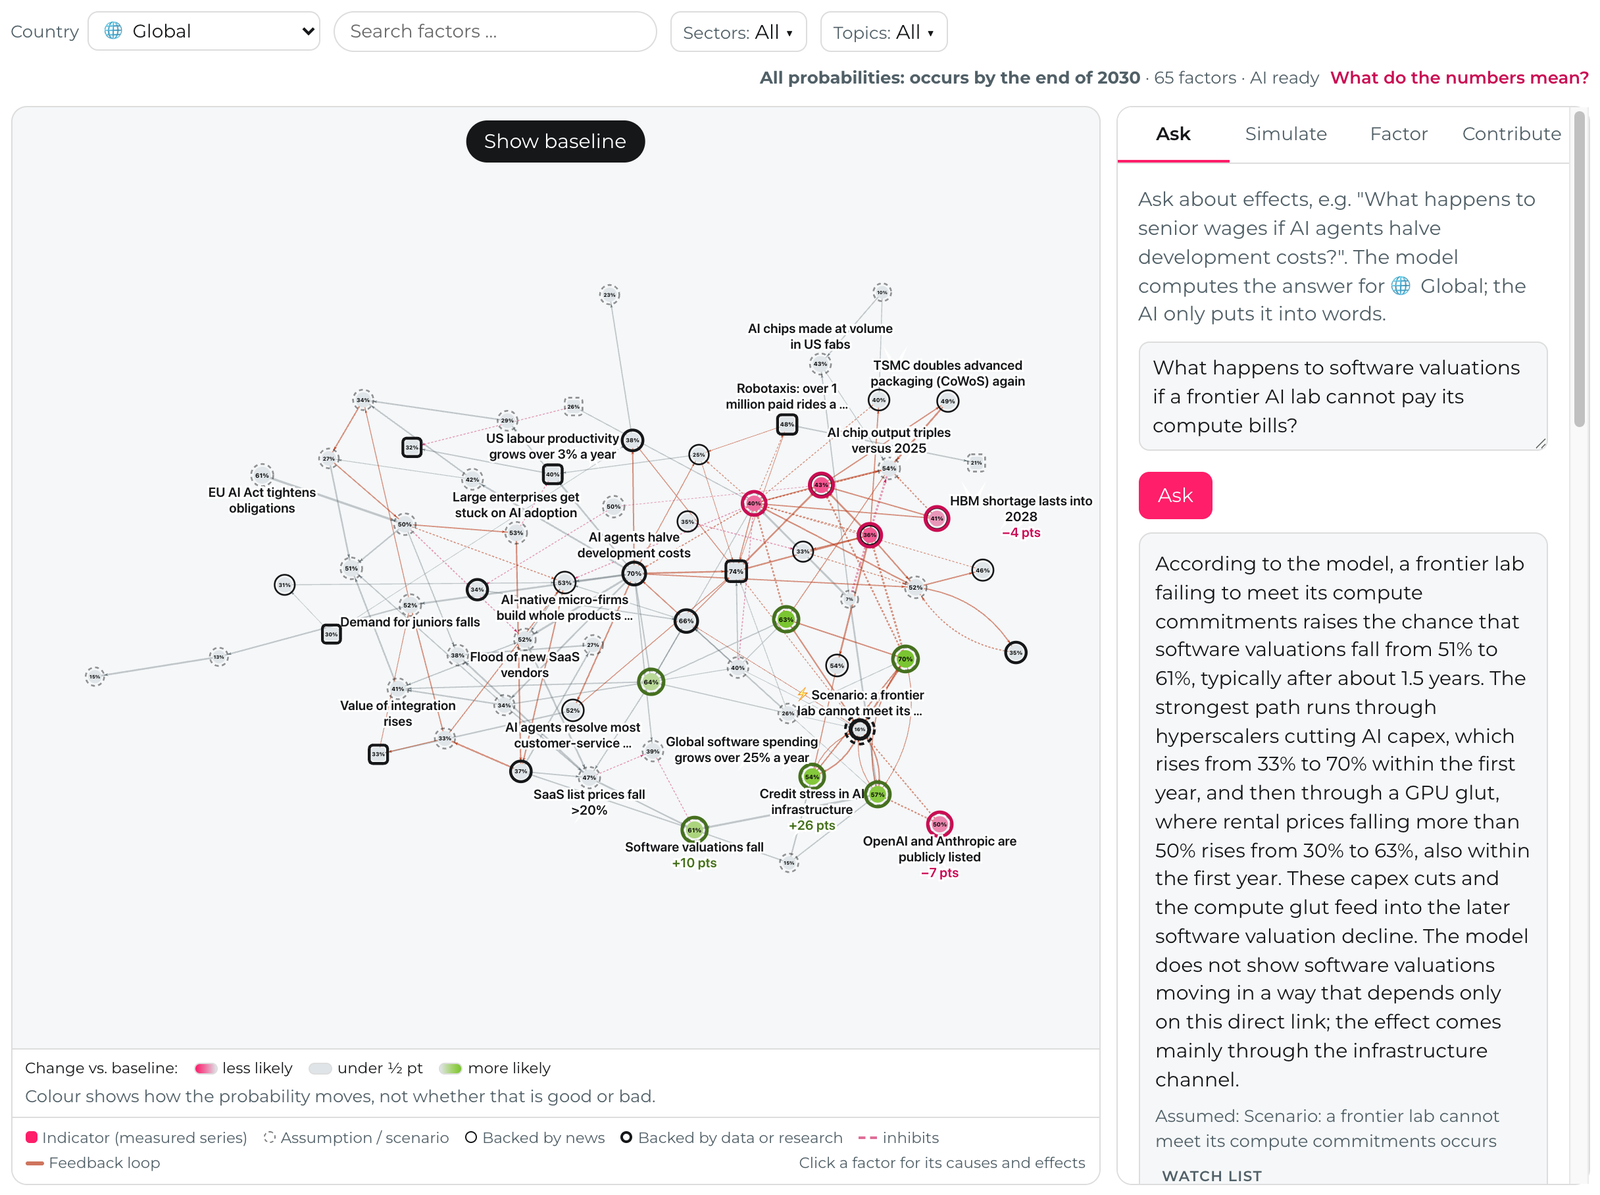
The Ask tab takes a question in plain language, for example "What happens to software valuations if a frontier AI lab cannot pay its compute bills?". The model maps the question to factors in the graph, the simulation computes the answer, and the AI puts it into words. Underneath the answer you see the factors that moved and the strongest paths between them.
Simulate a market scenario
The Simulate tab does the same without any AI: pick up to three of the ready-made events, such as a market crash, a rate shock or a surprise open-weights model, and see how it ripples through every factor. There are 15 events in six categories to start from. Or describe an event of your own and attach up to three effects to it, each with a strength and a delay. Nothing you simulate is saved.
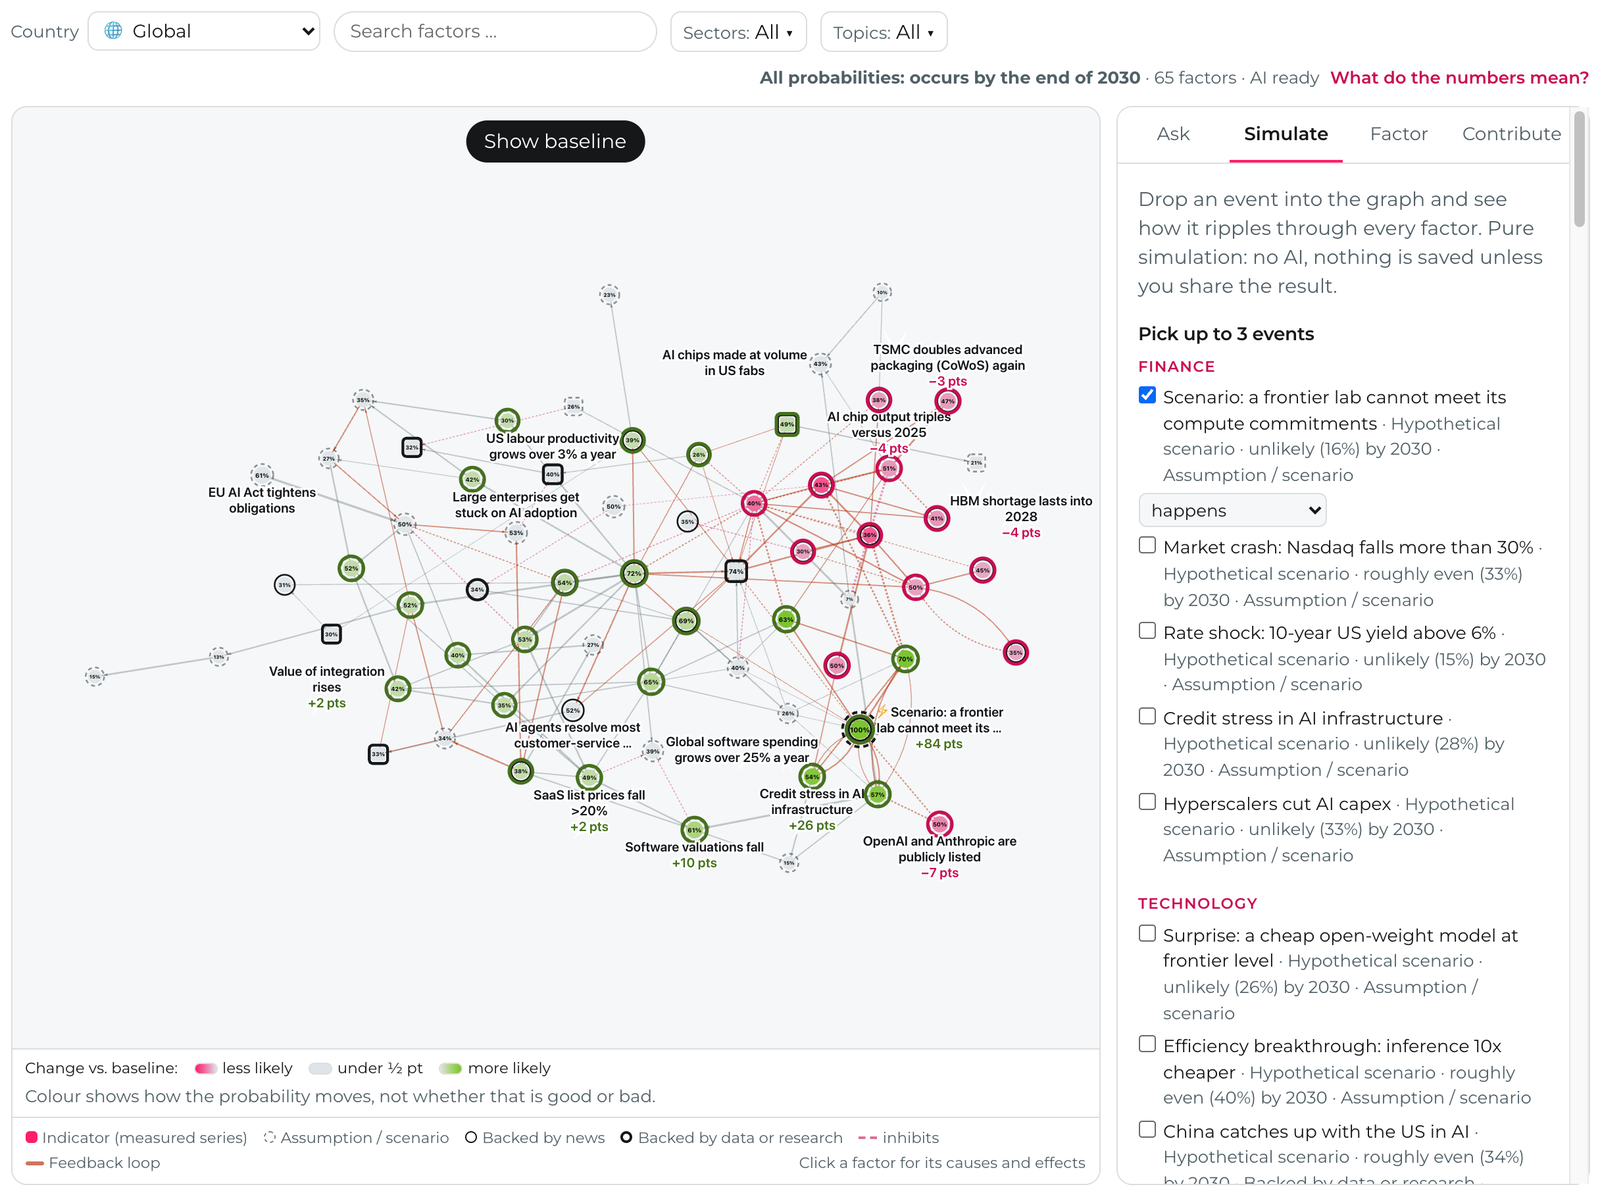
The colours show how a probability moves, not whether that is good or bad. A "Show baseline" button flips the graph back to the starting position so you can compare.
Switch the country
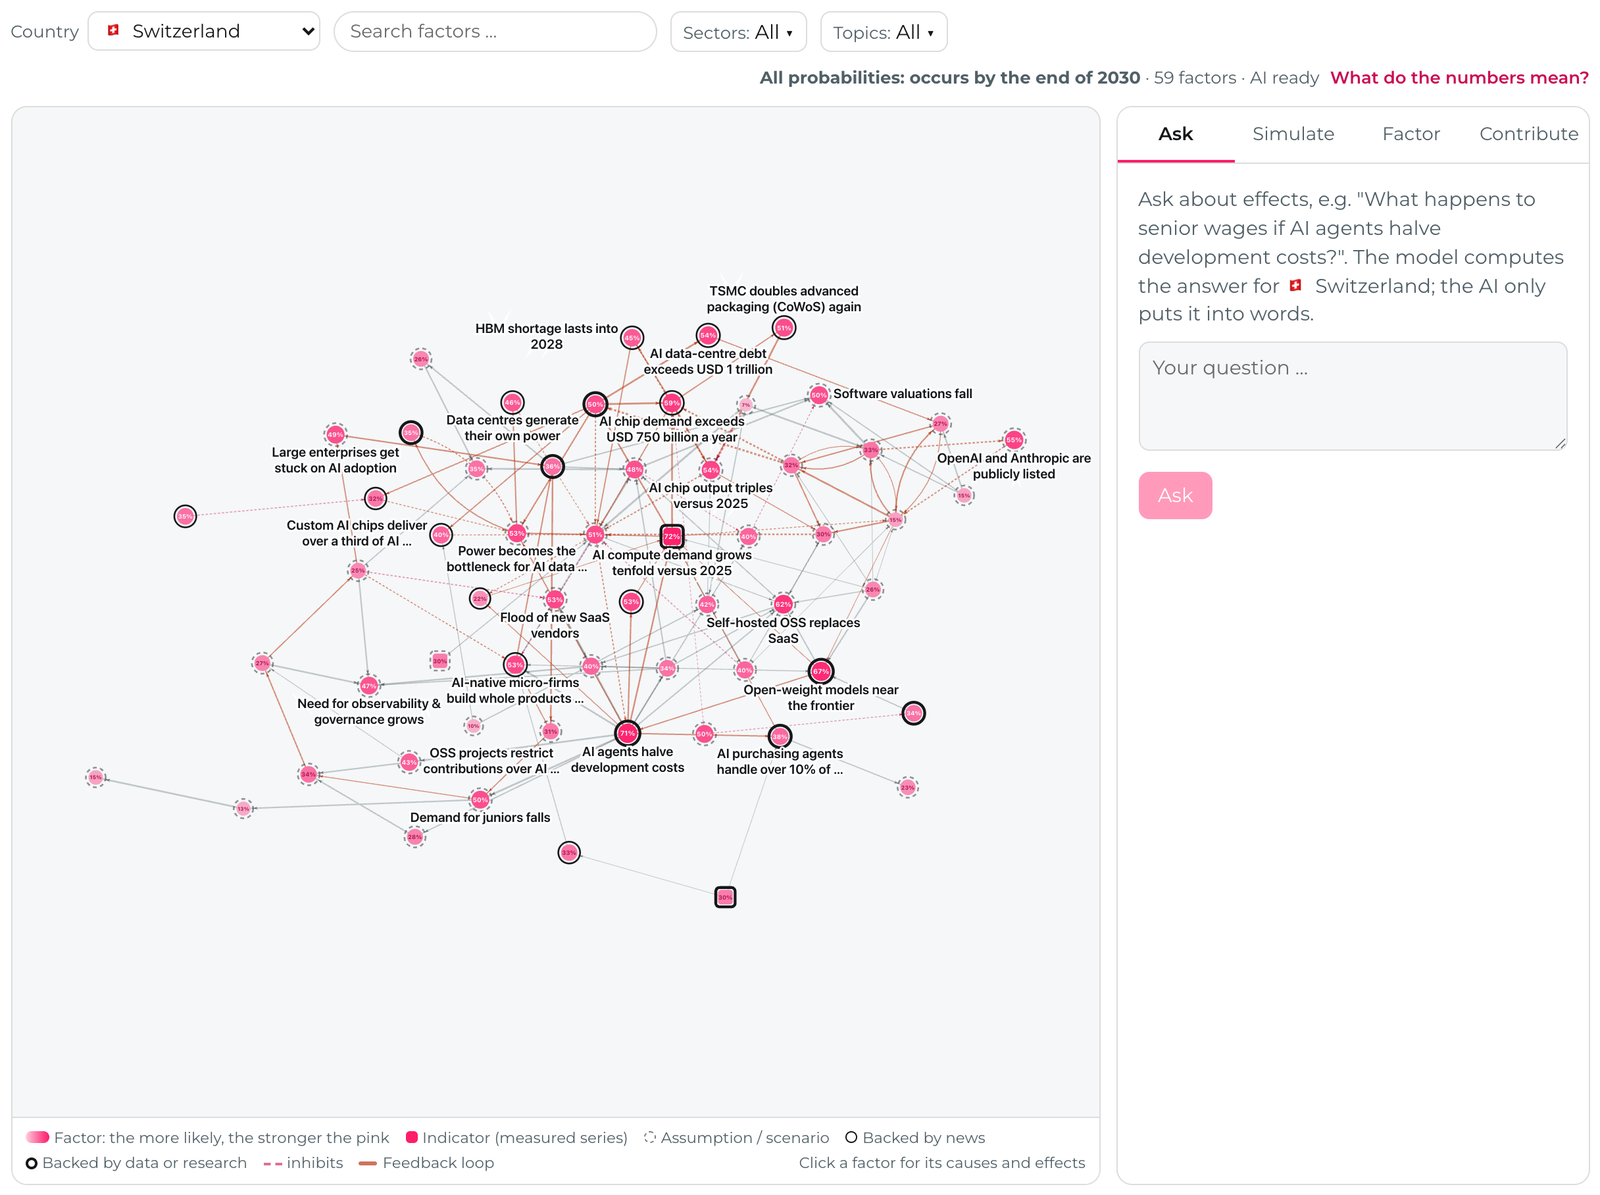
Markets do not move the same way everywhere. The country filter offers Global, the ten largest economies and Switzerland. It is one graph with country-specific parameters: a factor can apply only in some countries, and a base rate or a link strength can differ where the mechanism clearly differs. The Switzerland view, for instance, shows 59 of the 65 factors, because six apply only elsewhere. Questions and simulations then compute for the country you picked.
Contribute a relationship
Ripple gets better when more people look at it. In the Contribute tab you describe a relationship you see, for example "Cheaper AI translation lets Swiss SME software firms expand into the EU faster". You need to be signed in for this: use the sign-in in the top bar. Asking questions and exploring the graph need no account.
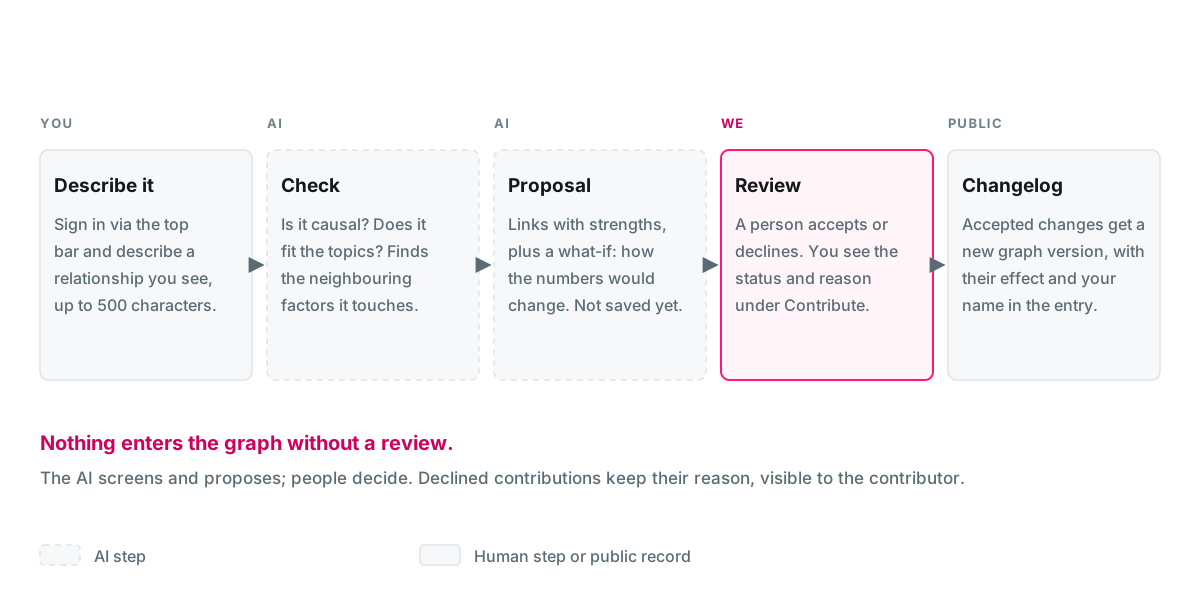
The AI checks whether your claim is causal and fits the topics, attaches it to the neighbouring factors, and shows what it would change in the graph. Nothing enters the graph until we have reviewed it. Under Contribute you see what became of each of your contributions, with the reason when one is declined. Accepted contributions get a new graph version, with their effect on the probabilities, and your name in the public changelog.
Share a result
When you have a result worth showing, share it. After an answer in Ask or a simulation in Simulate, the button "Share this answer" or "Share this result" turns it into a public link. Before it creates the link, Ripple tells you what becomes public: the question and answer, or the scenario and its result. Your name and account are never shown.
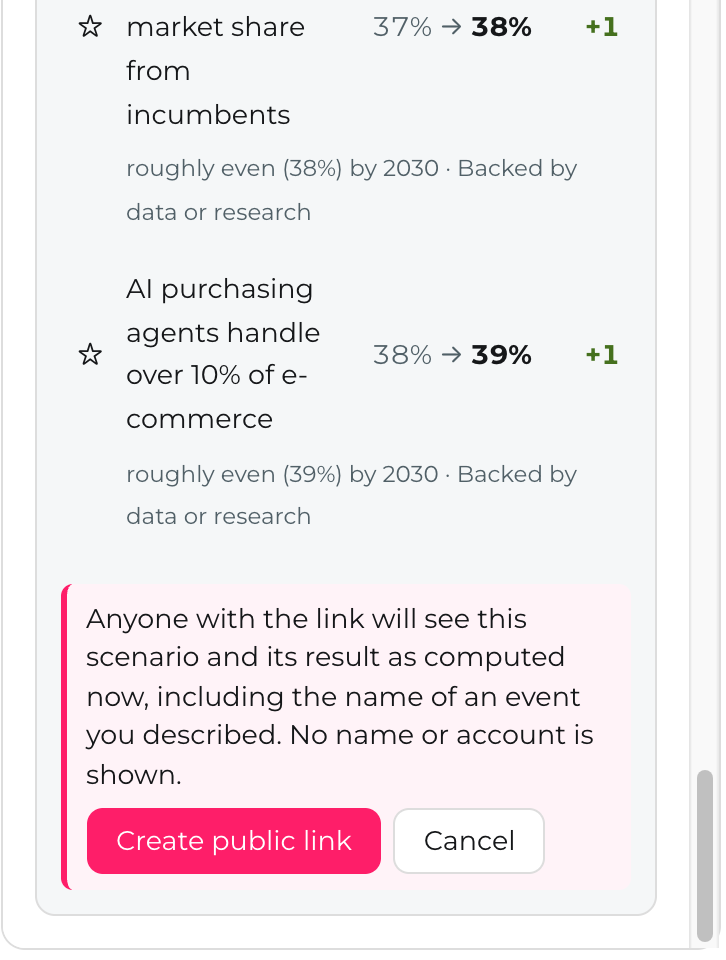
A share is a snapshot, not a live view:
- It is pinned to a graph version. Opening a shared simulation shows the banner "as of graph version N" with the date. The numbers never drift, even when the graph has changed since, and opening a share costs no AI call. A button on the page runs the same scenario on the current graph if you want to compare.
- It previews properly. Every share link has its own title, description and a 1200 by 630 image of the three biggest changes, so a link pasted into LinkedIn, X, WhatsApp or Facebook shows the result, not a generic card.
- It can be withdrawn. We can remove a share, and the link then says so instead of showing the result. A daily limit per visitor keeps link creation from being abused.
Every view of Ripple also has its own address: the country, the factor, the filters and a simulated scenario are kept in the link. That is the live version of a share, and it always computes on the current graph.
A worked AI bubble scenario: a lab that cannot pay
To show the pieces together, here is one scenario. We forced the graph's stress event "a frontier lab cannot meet its compute commitments" to occur, and asked what else changes. This is a stress test, not a prediction. In the model it has a baseline probability of 16% over the horizon, and there is no sign that any lab is in that position today.
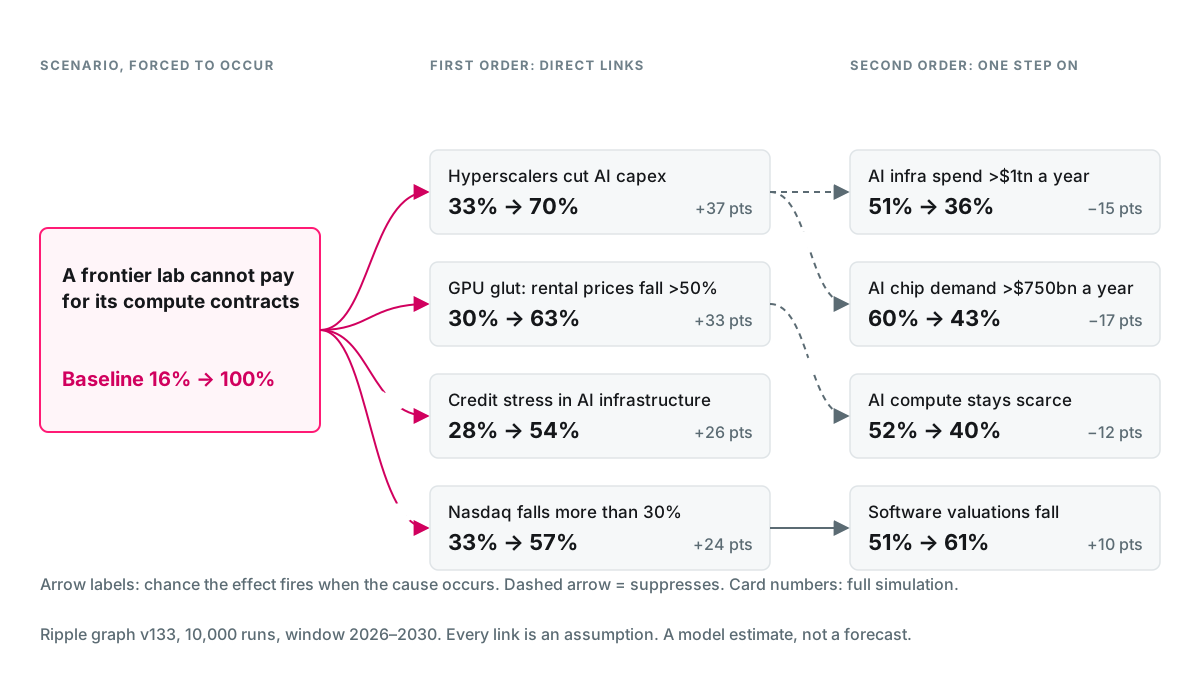
The direct effects move hard: hyperscalers cutting AI capex goes from 33% to 70%, a GPU glut from 30% to 63%, credit stress in AI infrastructure from 28% to 54%, and a Nasdaq fall of more than 30% from 33% to 57%. One step further, AI infrastructure spending above $1 trillion a year becomes less likely (51% to 36%), compute stops being scarce (52% to 40%), and software valuations fall (51% to 61%). Read the other way round, the graph says that credit stress is the strongest trigger of such an event, ahead of technology surprises.
Read the limits as carefully as the numbers. The figures are model estimates from graph version 133, read on 16 October 2026, and they move when the graph changes. The window is 2026 to 2030, not next quarter. And every one of the 150 links in that version is an assumption, a reasoned judgement written down so that it can be challenged. You can open this exact result as a shared snapshot, pinned to graph version 133, and re-run it on the live graph from there; the live numbers may differ if the graph has changed since.
Help us predict the future
We said at the start that nobody knows what happens next. Ripple is our attempt to make the guessing structured and open to challenge, and it works only if more people look at it than we are. Here is how to take part, in the order of how much it helps:
- Contribute a relationship you see. A cause and effect the graph is missing, or a link whose strength you think is wrong. Open the Contribute tab.
- Bring evidence for our assumptions. All 150 links are assumptions today. A study, a statistic or a dataset that backs or contradicts one is the most valuable thing you can send.
- Run your own scenarios and share them from the Simulate tab. A shared result is pinned to its graph version, so everyone who opens it sees the same numbers. Post the link wherever you discuss markets, especially when the ripple surprises you: surprises are where the graph is most likely wrong.
- Challenge a number. If a probability looks off to you, follow the factor back to its causes and tell us which link you would change.
Ripple is in beta, the graph is still growing, and the numbers are model estimates, not forecasts you should bet on. If we are going to be wrong, we would rather be wrong in public, with your help to get it right. Open Ripple and add the first link you see.