Cut your observability bill at the source
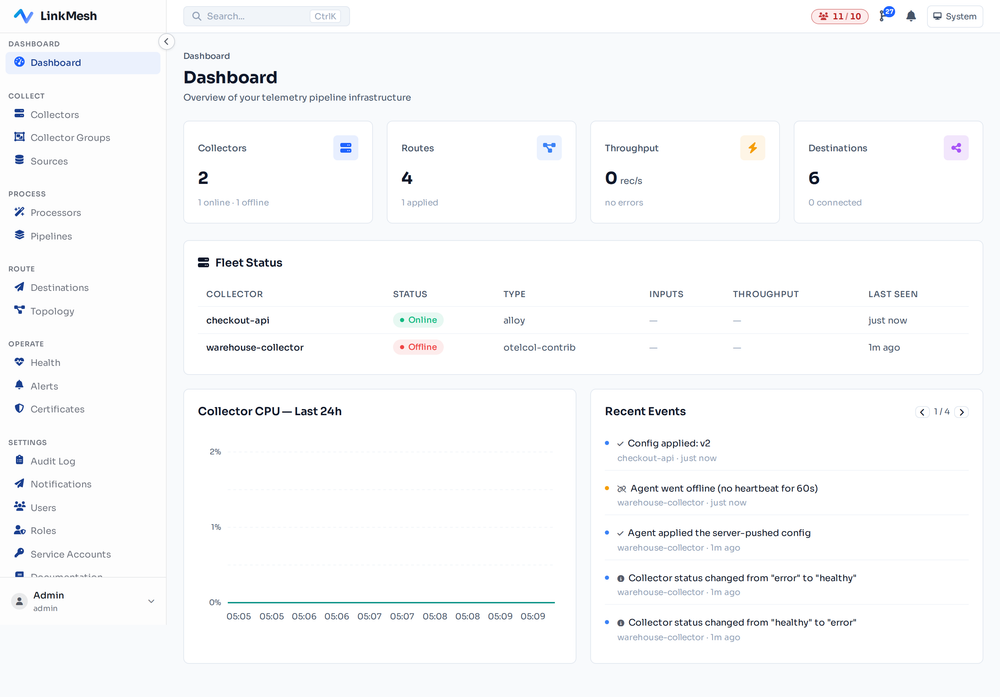
Today we're launching LinkMesh (early access) — a control plane for your OpenTelemetry collector fleet that lets you drop the noise, redact the risk, and route what's left, all before a single byte leaves your network. We built it because the fastest-growing line item in most engineering budgets isn't compute or headcount. It's observability.
"LinkMesh.io is for OpenTelemetry Collector Config Management and Edge Connector / Data Onboarding. And the best part is: No volume based licensing. Attractive pricing per Collector with a Cap. Management of 25 collectors for free (full feature set) forever."
opensight.ch - roman hüsler
The bill nobody budgeted for
Logs, metrics, and traces are priced by the gigabyte ingested, the series stored, and the query run. So every team quietly ships everything to their backend and finds out the cost at renewal. The uncomfortable truth: most of what you're paying to ingest, store, and index is data nobody will ever look at.
- Health-check and readiness-probe logs — thousands of lines an hour that say "200 OK".
- Debug logging left on in production after an incident that closed months ago.
- High-cardinality labels — a request ID or pod name on a metric, multiplying your time series.
- Duplicated and unparsed fields riding along in every event.
- PII — emails, card numbers, tokens — that you are now both paying to store and legally liable for.
Why the usual fixes don't work
Switching vendors just moves the meter. Blunt, global sampling throws away the signal you actually needed at 3am. And hand-editing collector configuration across a fleet of hundreds of hosts doesn't scale — it drifts, it breaks, and nobody is sure which host is running which YAML.
The only durable fix is to send less: shape your telemetry at the edge — drop, redact, aggregate, and route it — before it leaves your network, and do it centrally across every collector at once.
Meet LinkMesh: a control plane for your collector fleet
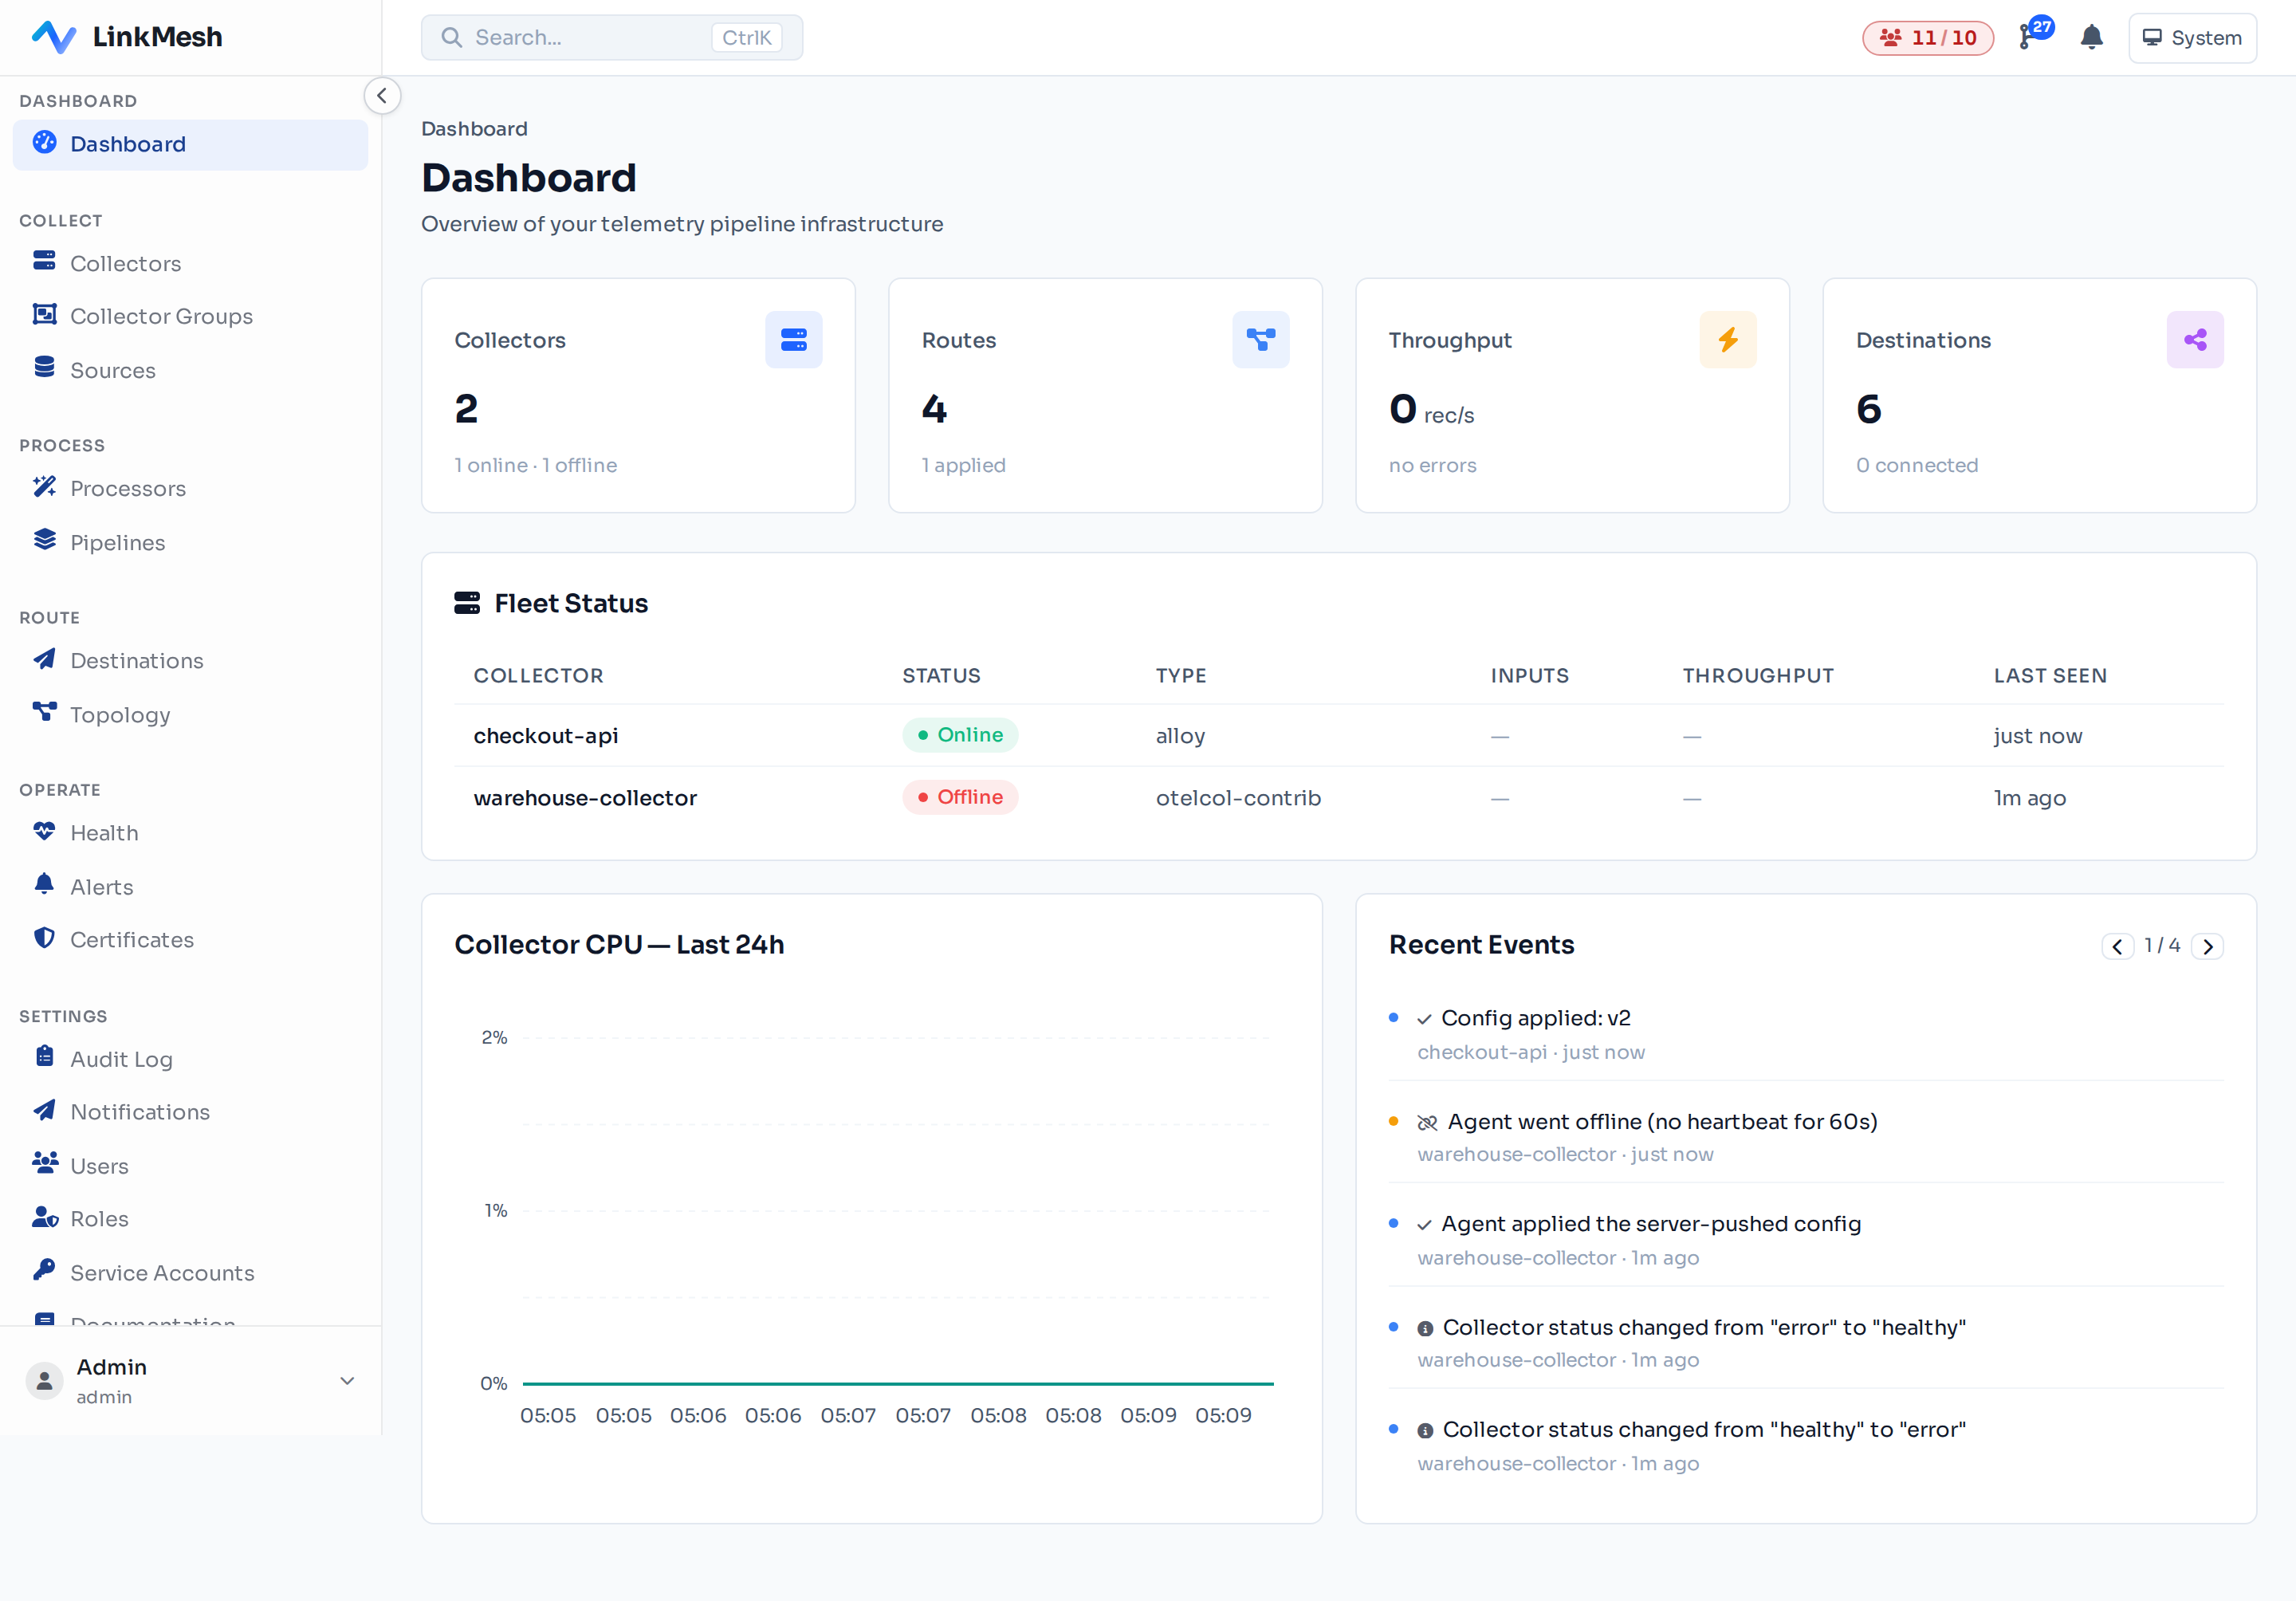
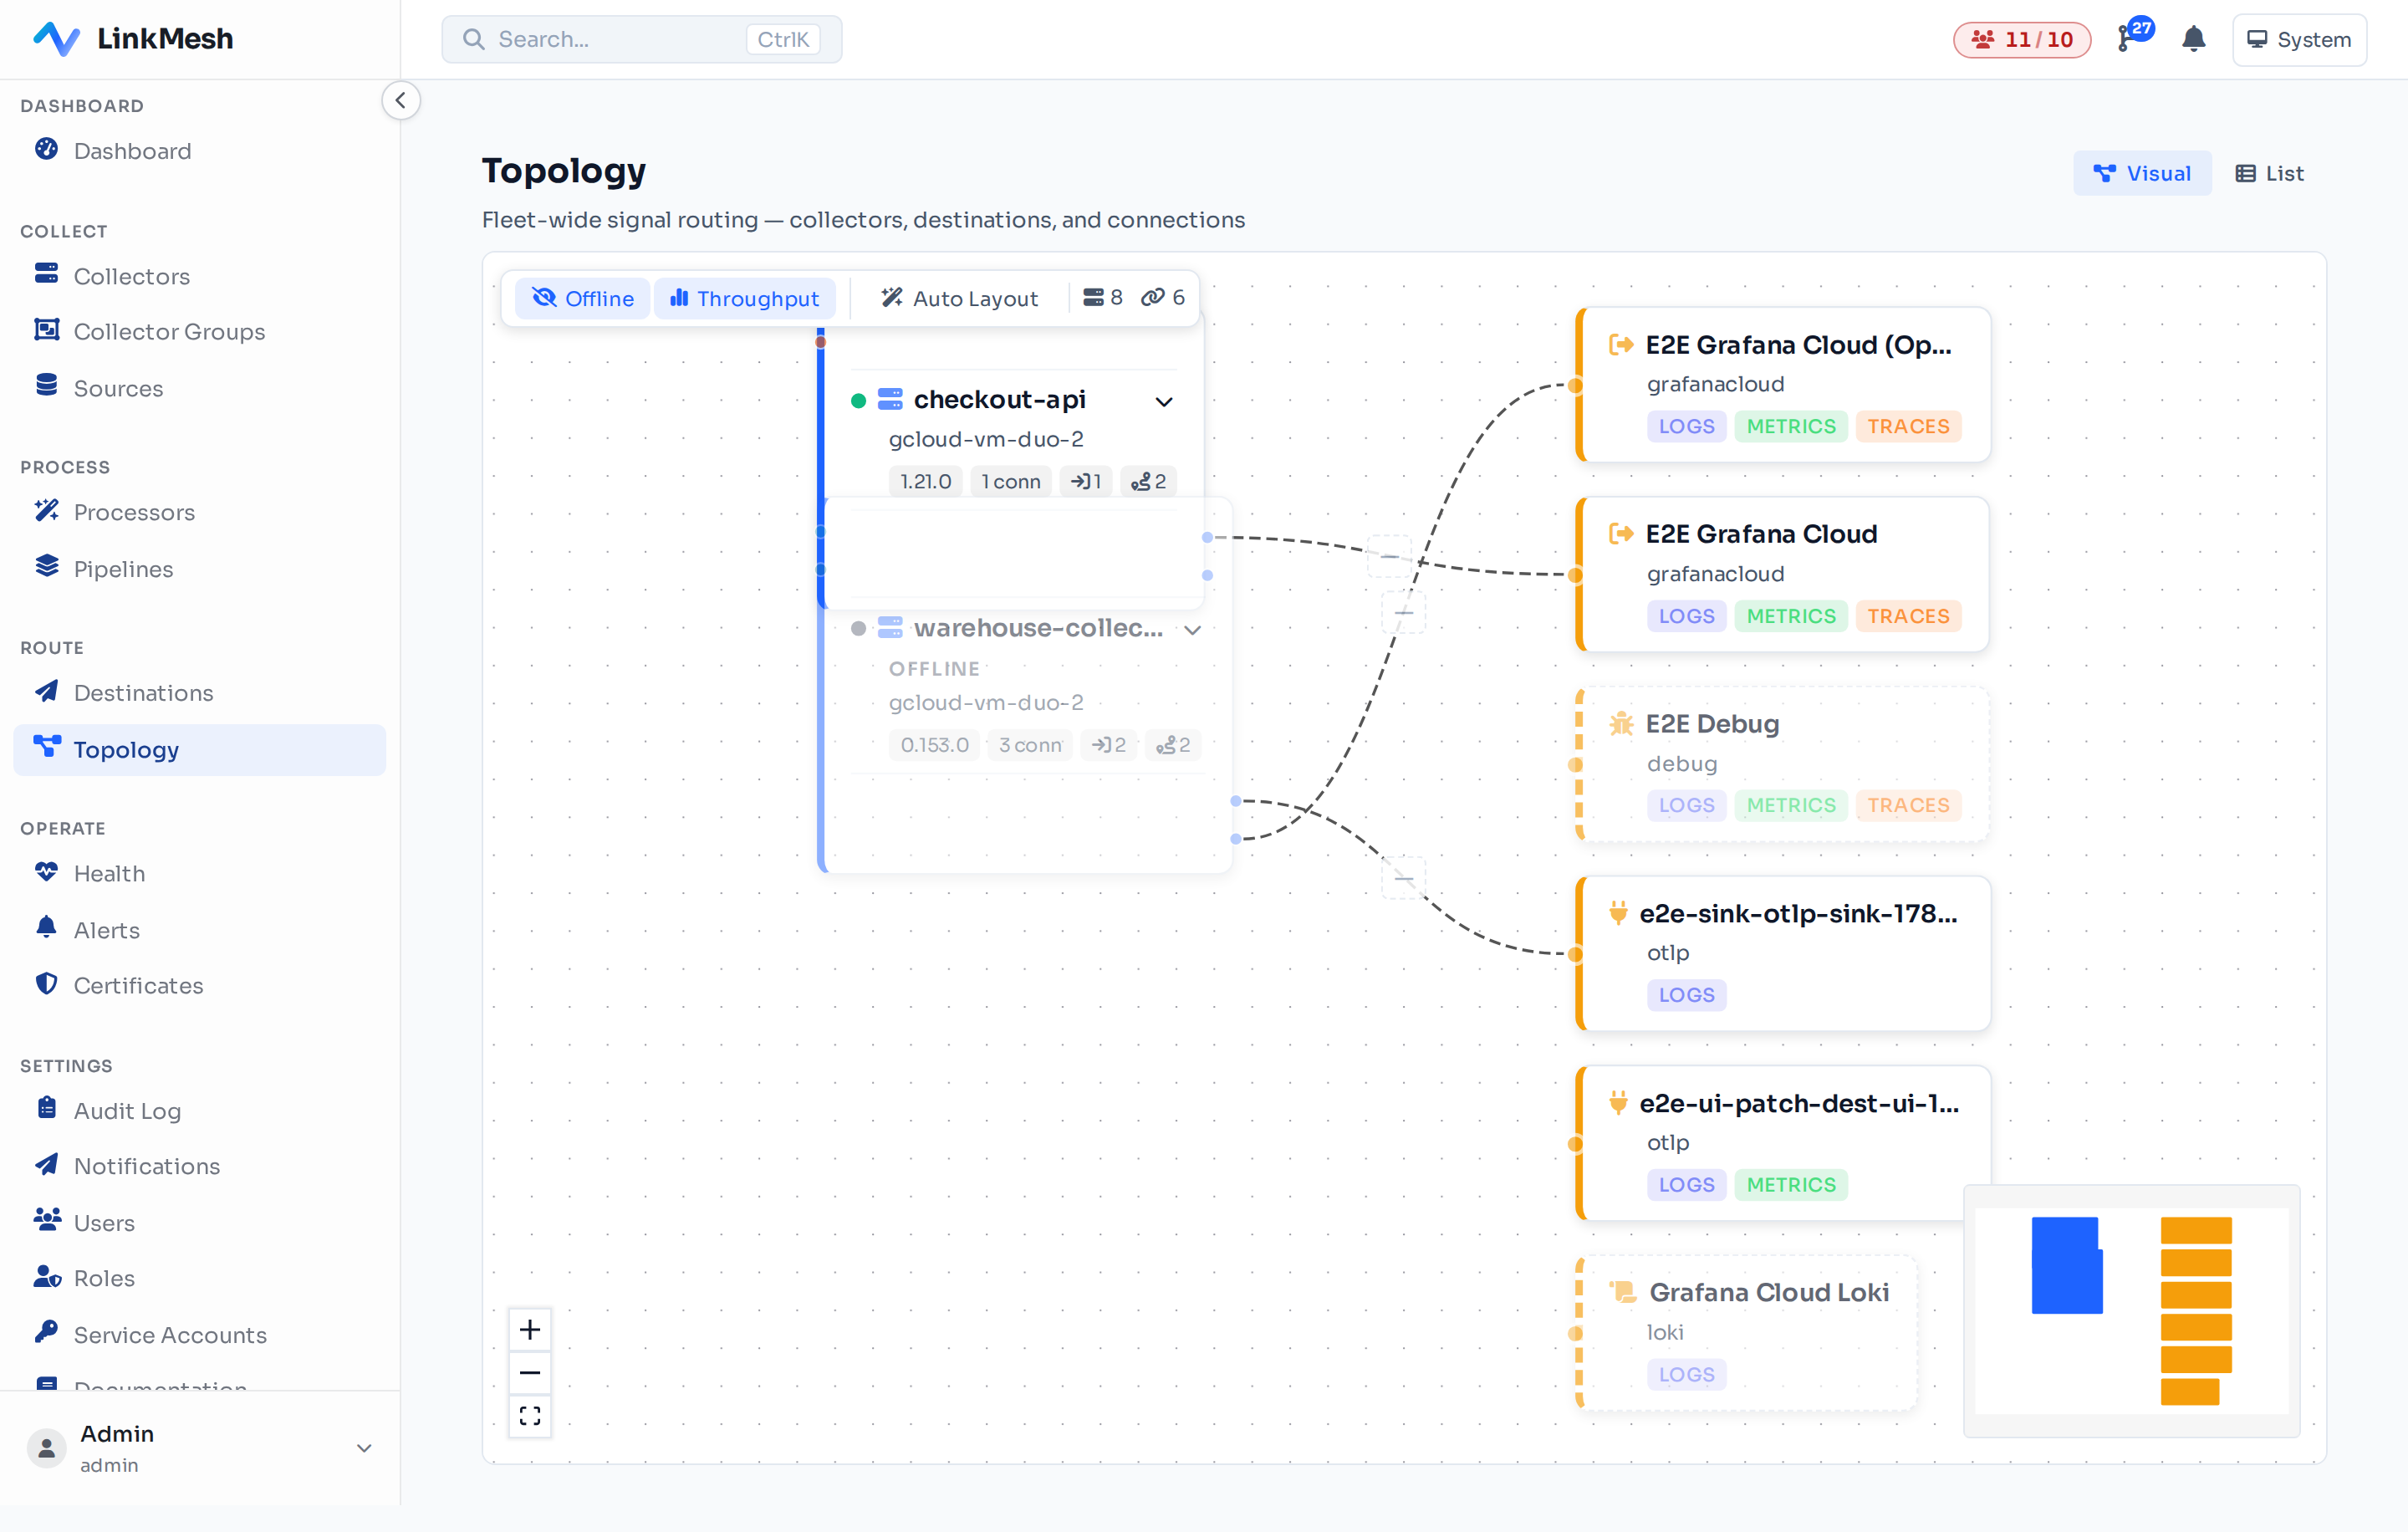
LinkMesh sits alongside your OpenTelemetry collectors — upstream otelcol or Grafana Alloy, whichever you run — as a control plane. Sources flow into collectors, through pipelines you design, and out to your destinations.
One detail matters more than any other: your telemetry never transits LinkMesh. Data goes straight from your collectors to your backends. LinkMesh moves configuration, not your data — so adopting it adds no hop, no latency, and no new place for your logs to leak.
Pipelines are your cost lever
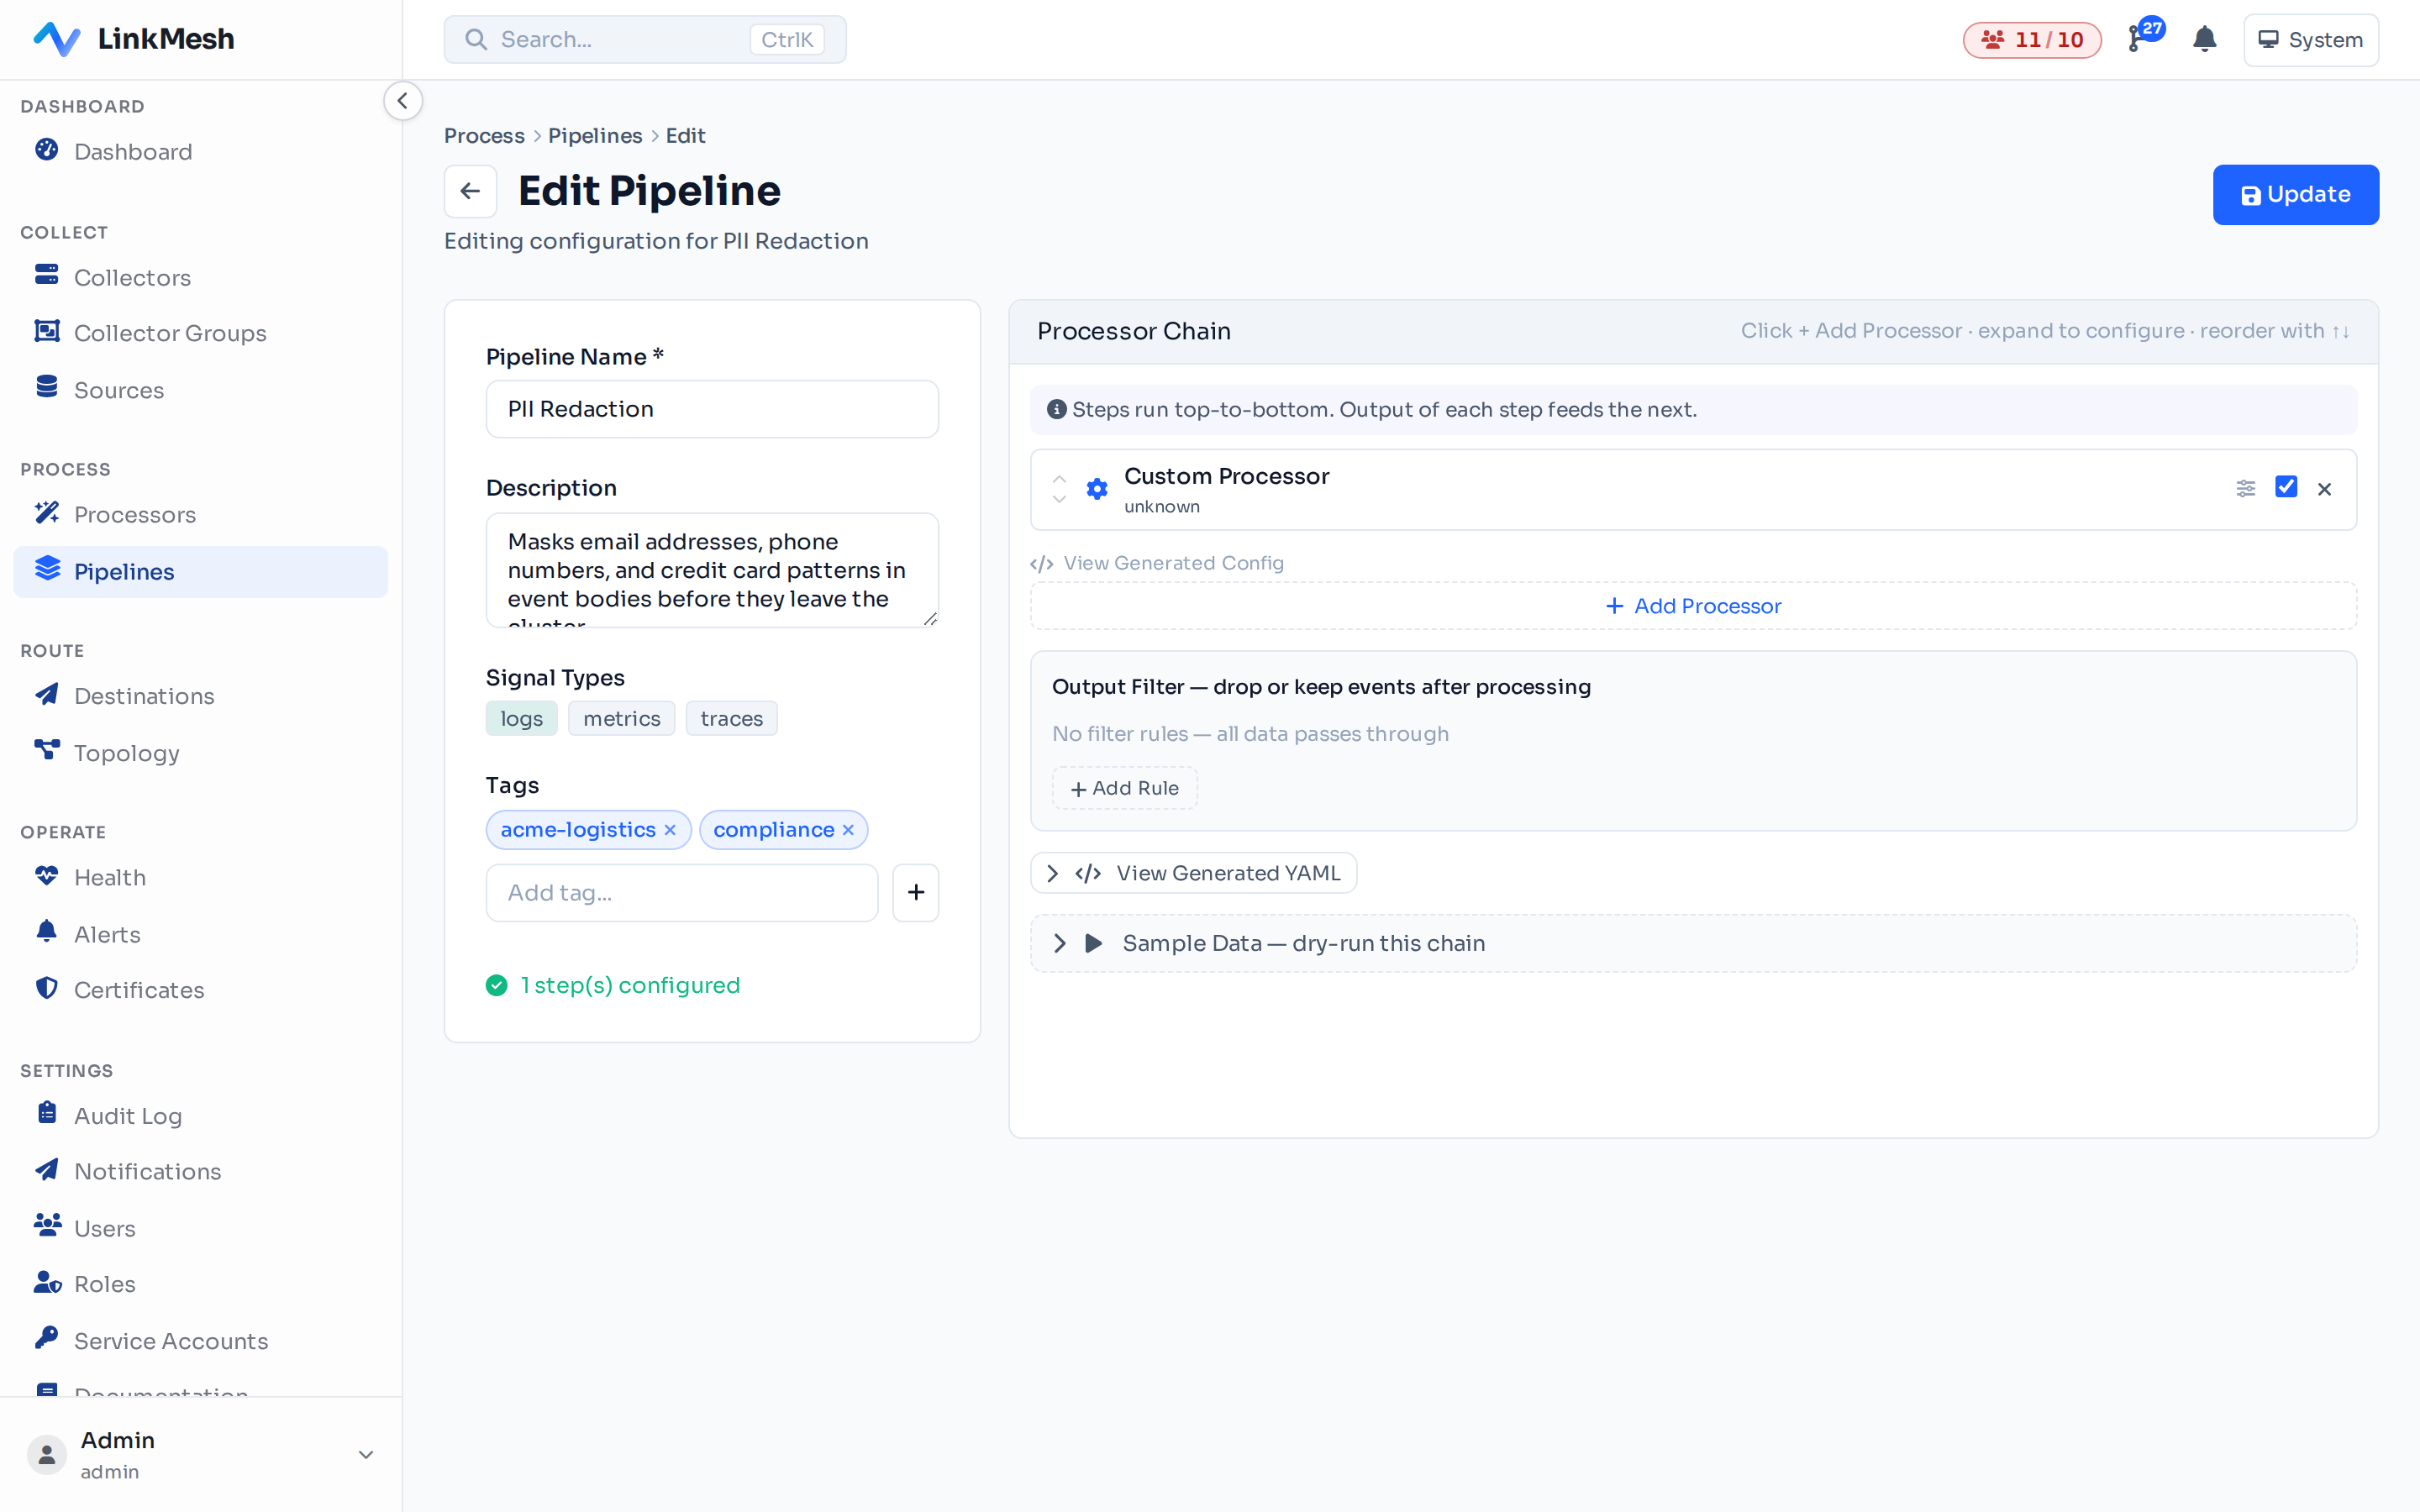
A pipeline is a chain of processors you build with drag-and-drop — no OTTL by hand, no redeploys. Three of them pay for themselves the day you turn them on.
1. Drop the noise
A "Drop Health Checks" filter strips readiness probes and access-log chatter before they're ever counted. A few rules routinely remove 10–30% of log volume that had zero diagnostic value.
2. Redact the risk
Mask emails, card numbers, and tokens in event bodies at the edge. You stop paying to store data you're on the hook for — and your telemetry backend stops being an accidental copy of your customer database.
3. Prove it before you ship it
This is the part teams love. Paste a real sample event and dry-run the pipeline: LinkMesh shows you the exact before-and-after, step by step. No "deploy and pray", no discovering you dropped the wrong field a week later.
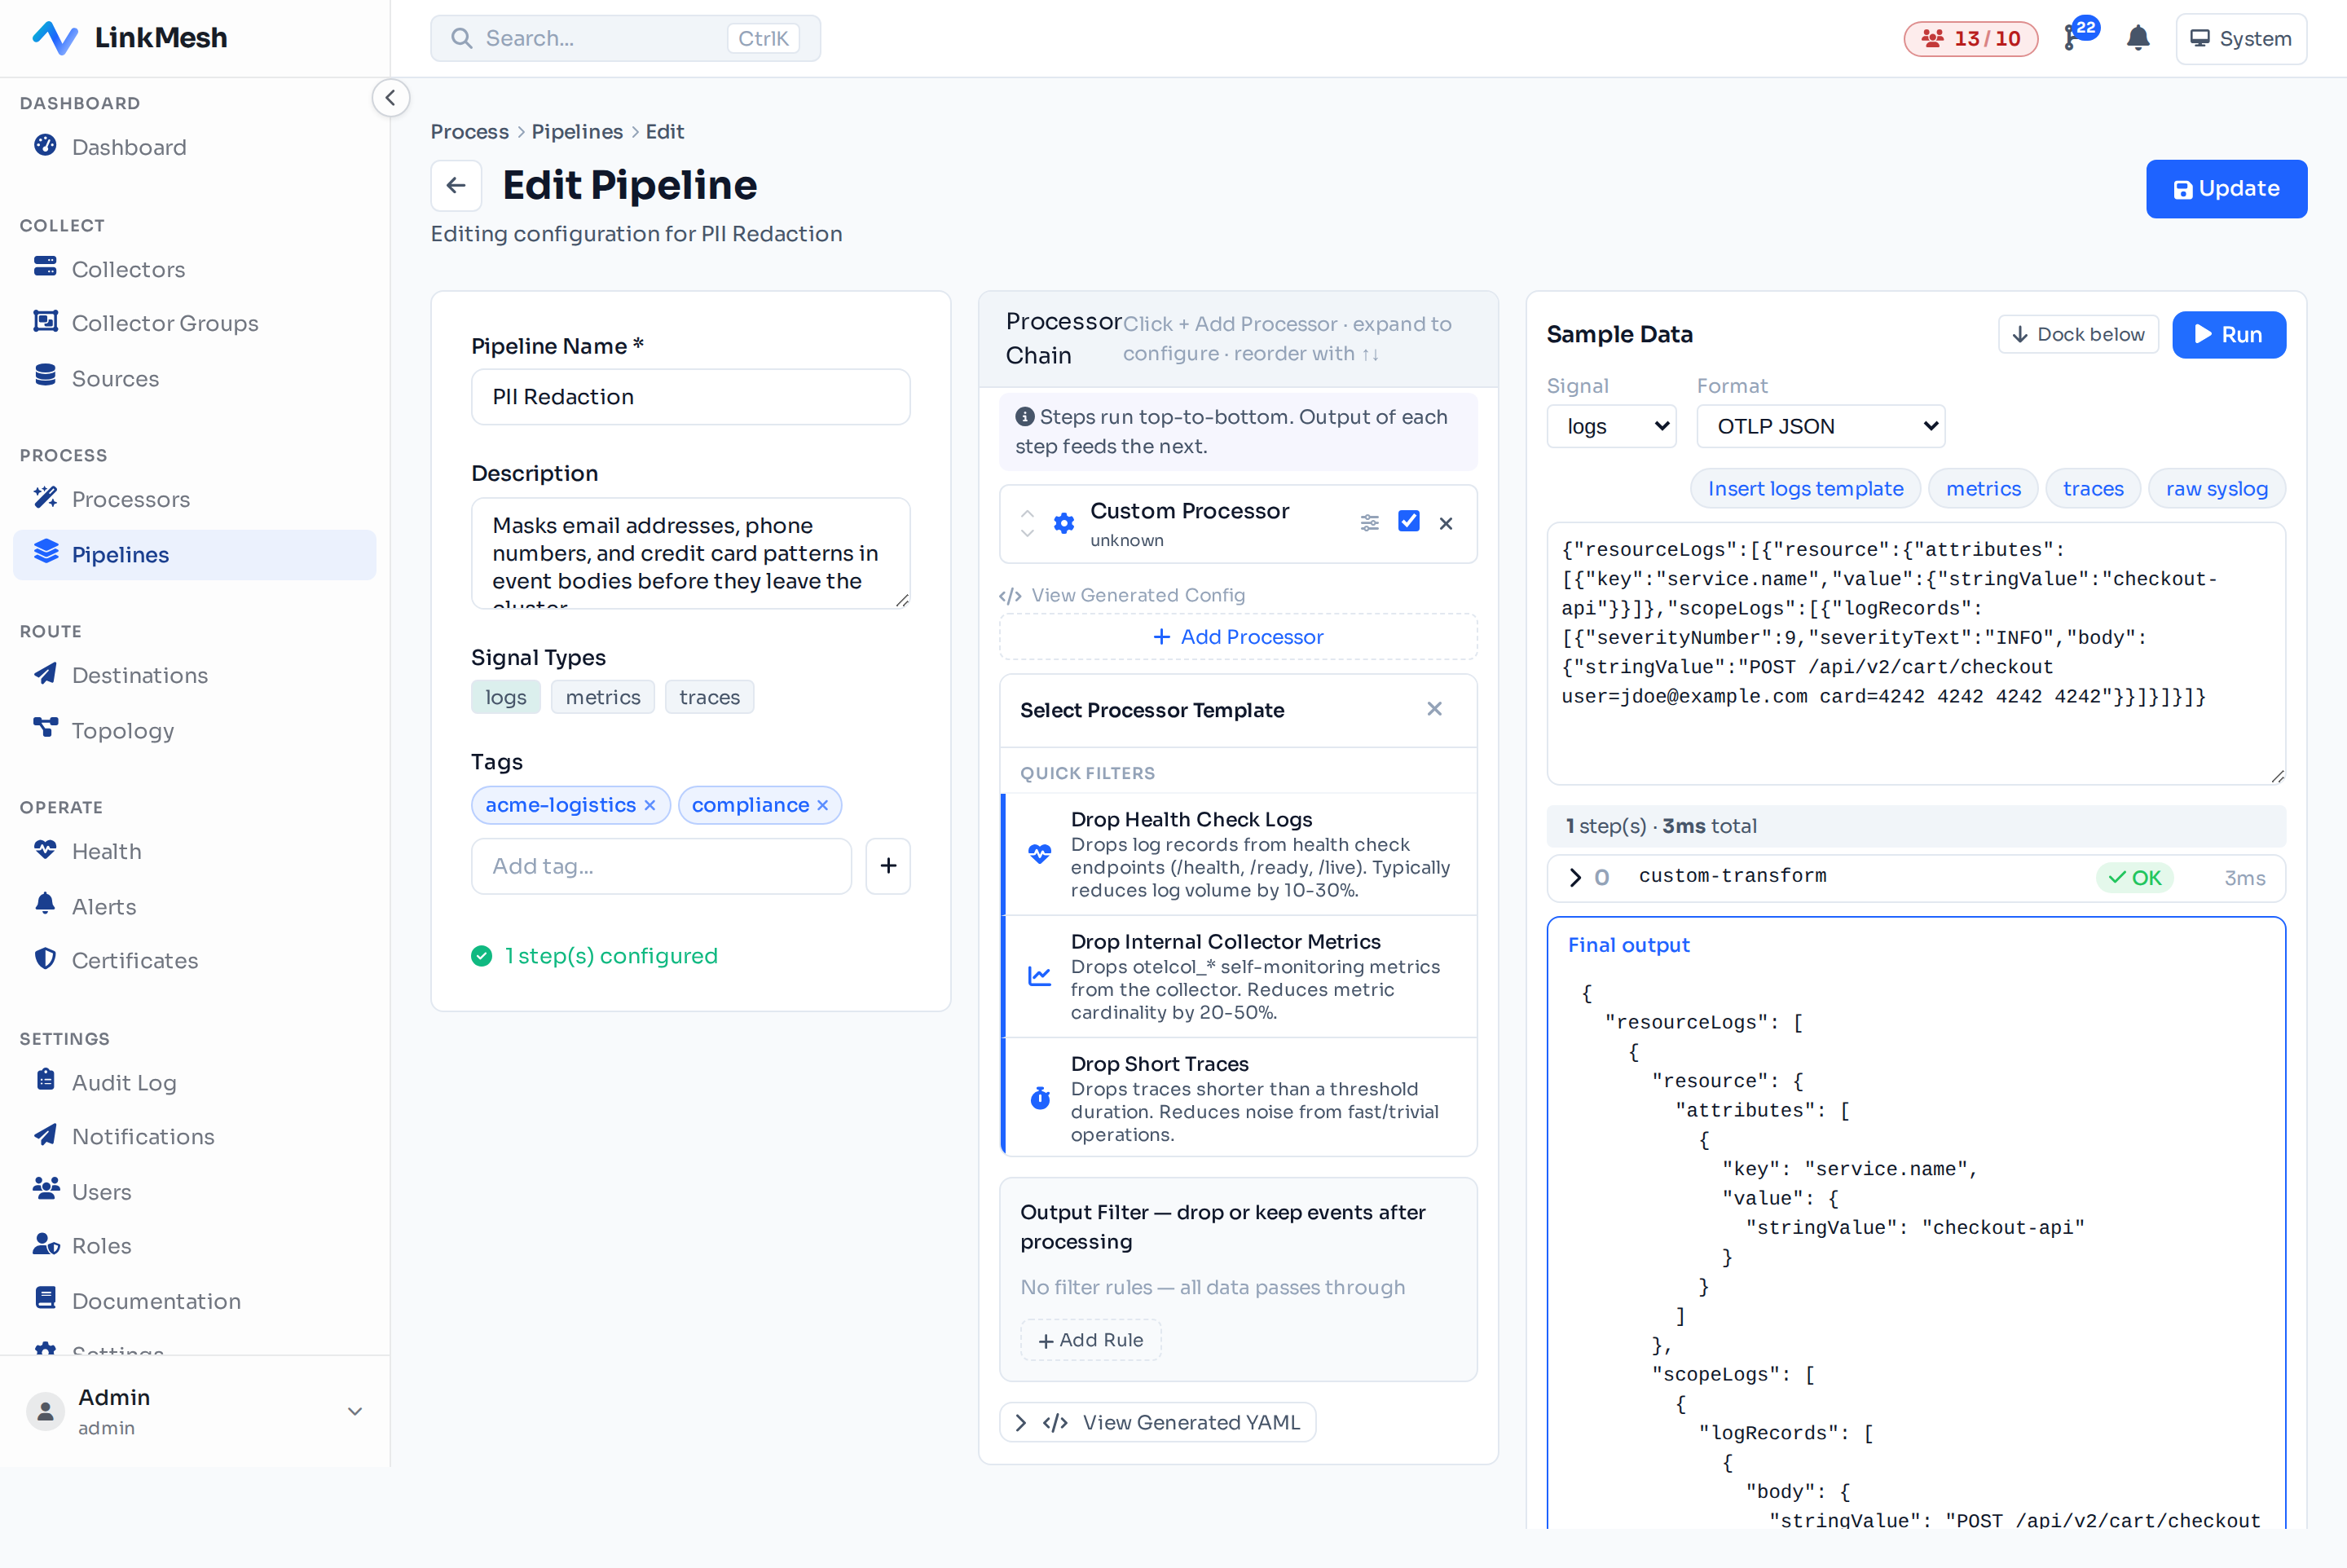
One pipeline, your whole fleet — no YAML
Design a pipeline once and push it to every collector that needs it. LinkMesh delivers configuration over OpAMP or Alloy's native remotecfg, so a rescheduled pod or a new host picks up the right config automatically. Then you watch the volume actually drop — on the same canvas, in records per second, per collector.
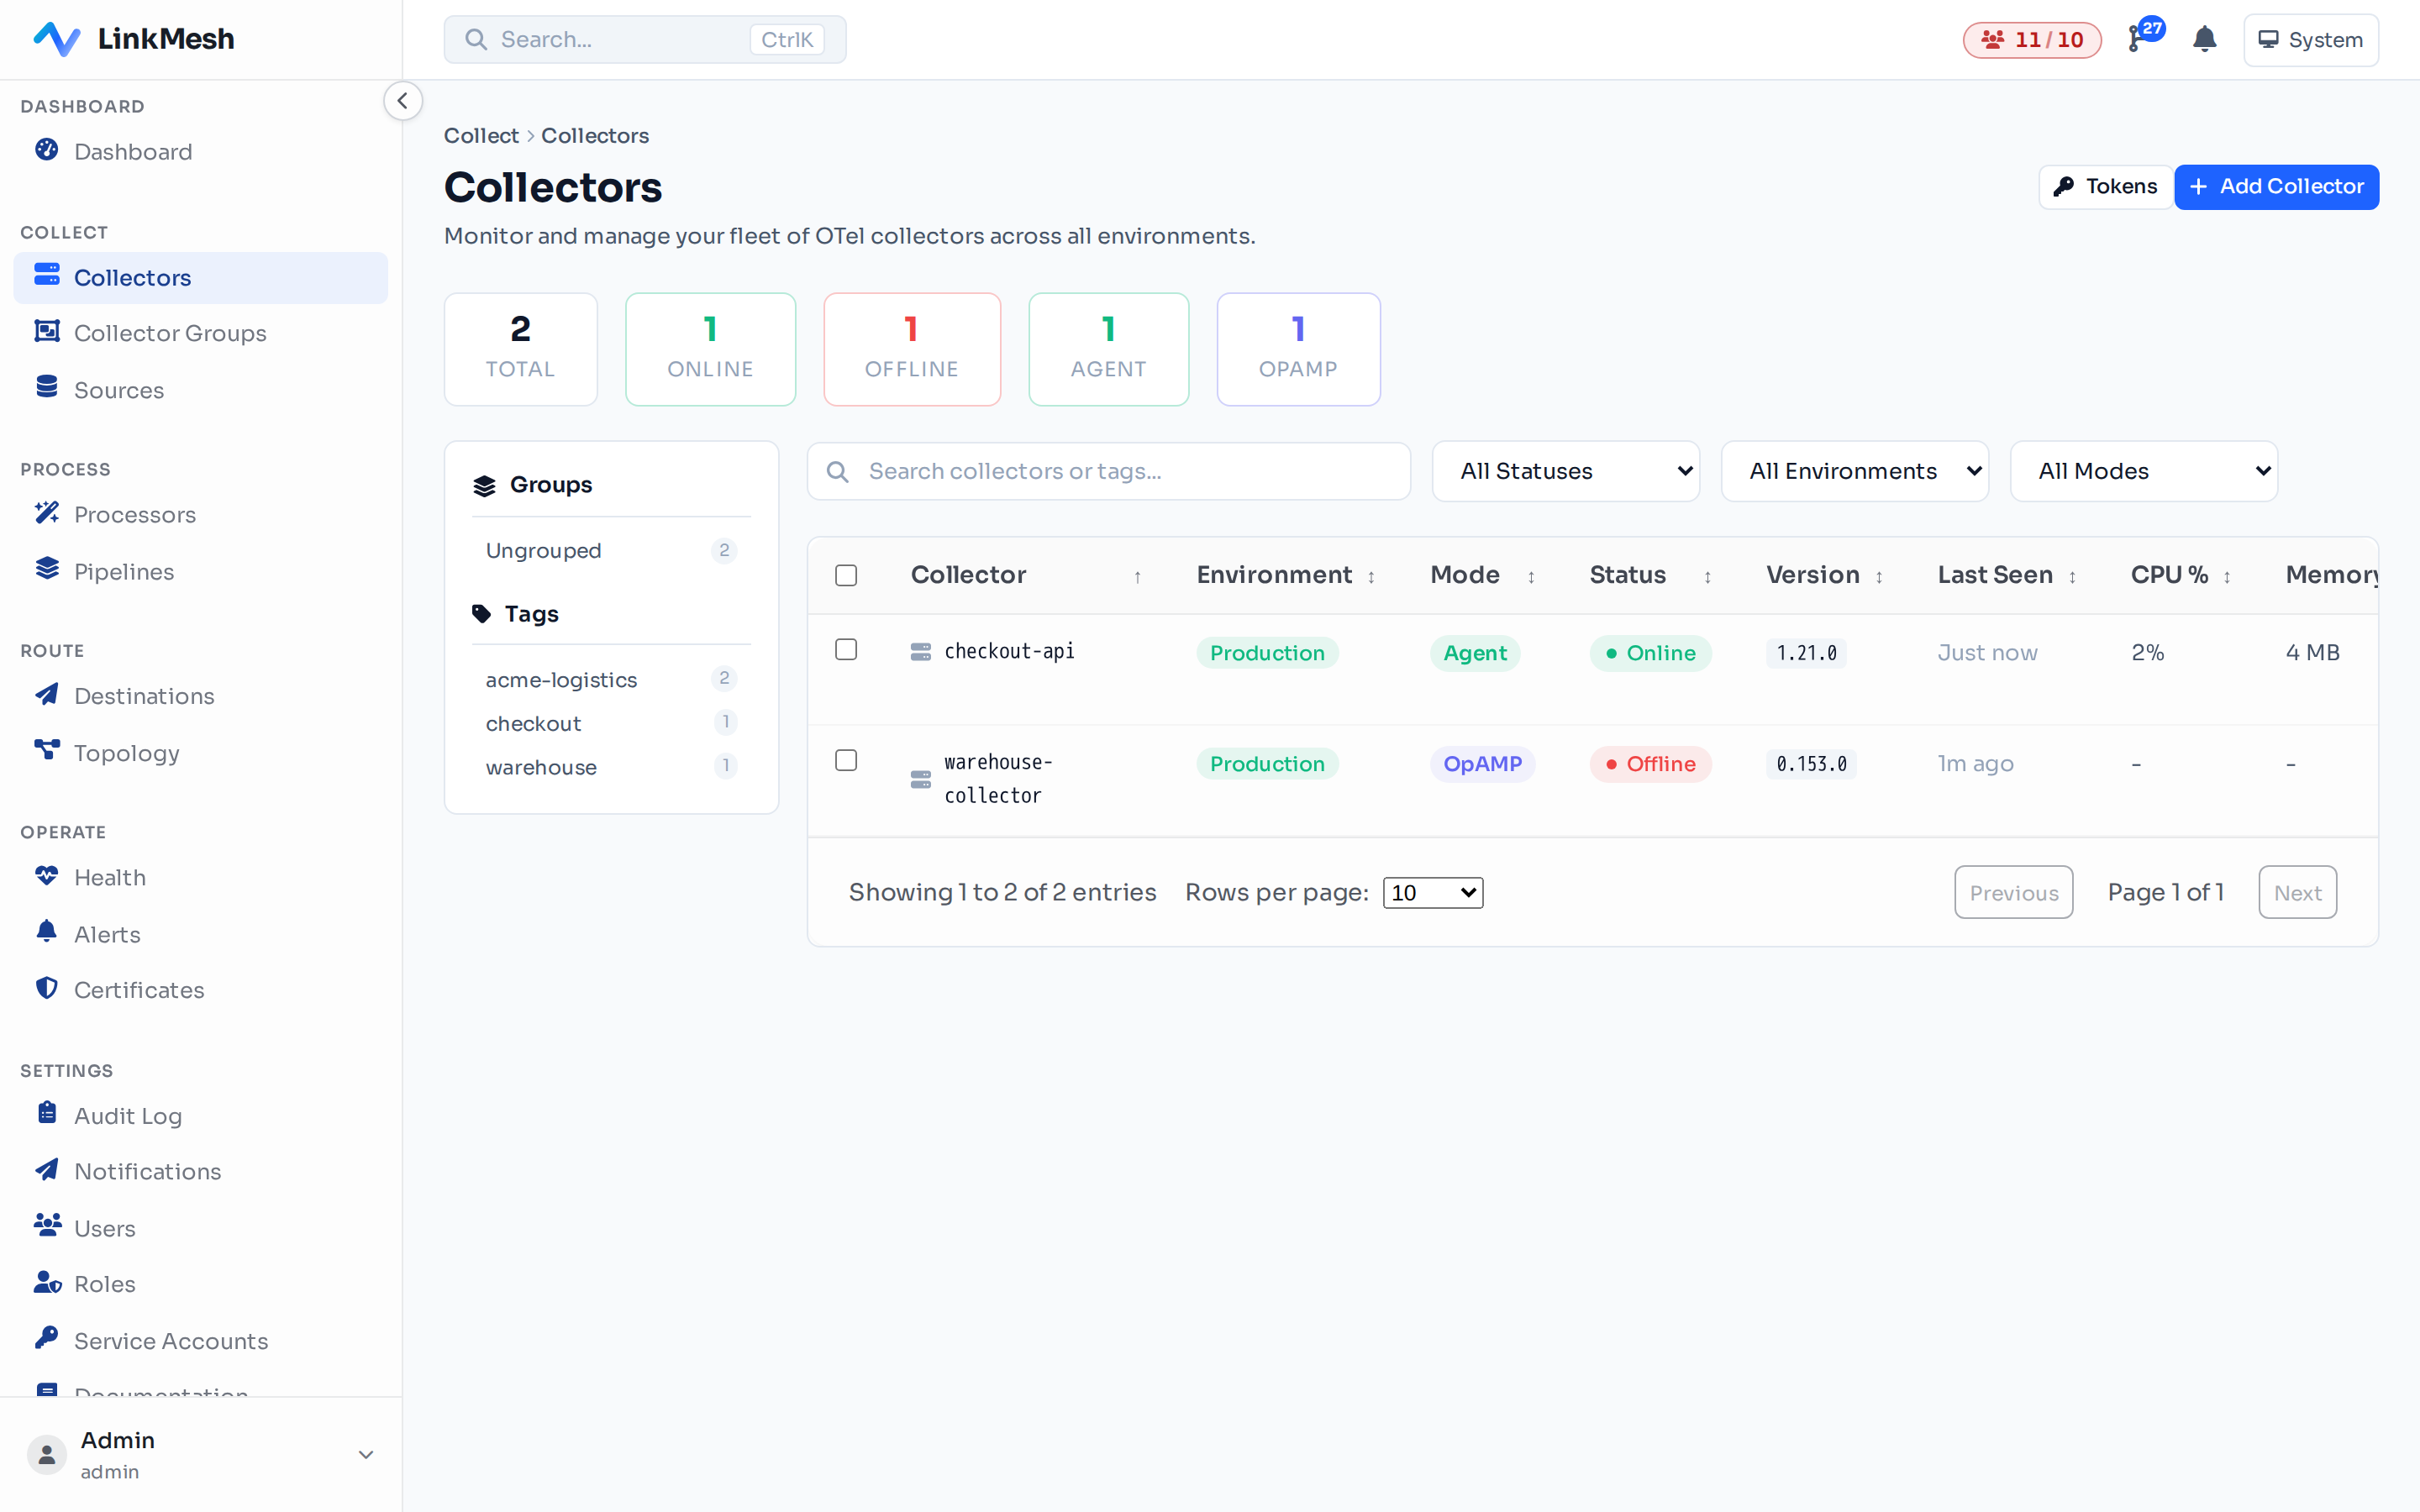
Send what's left where it belongs
Whatever survives your pipelines gets routed by signal type and label to the destinations you already use — Grafana Cloud, Loki, Tempo, Prometheus, Kafka, S3, and more. Configure a destination once; reuse it across every route.
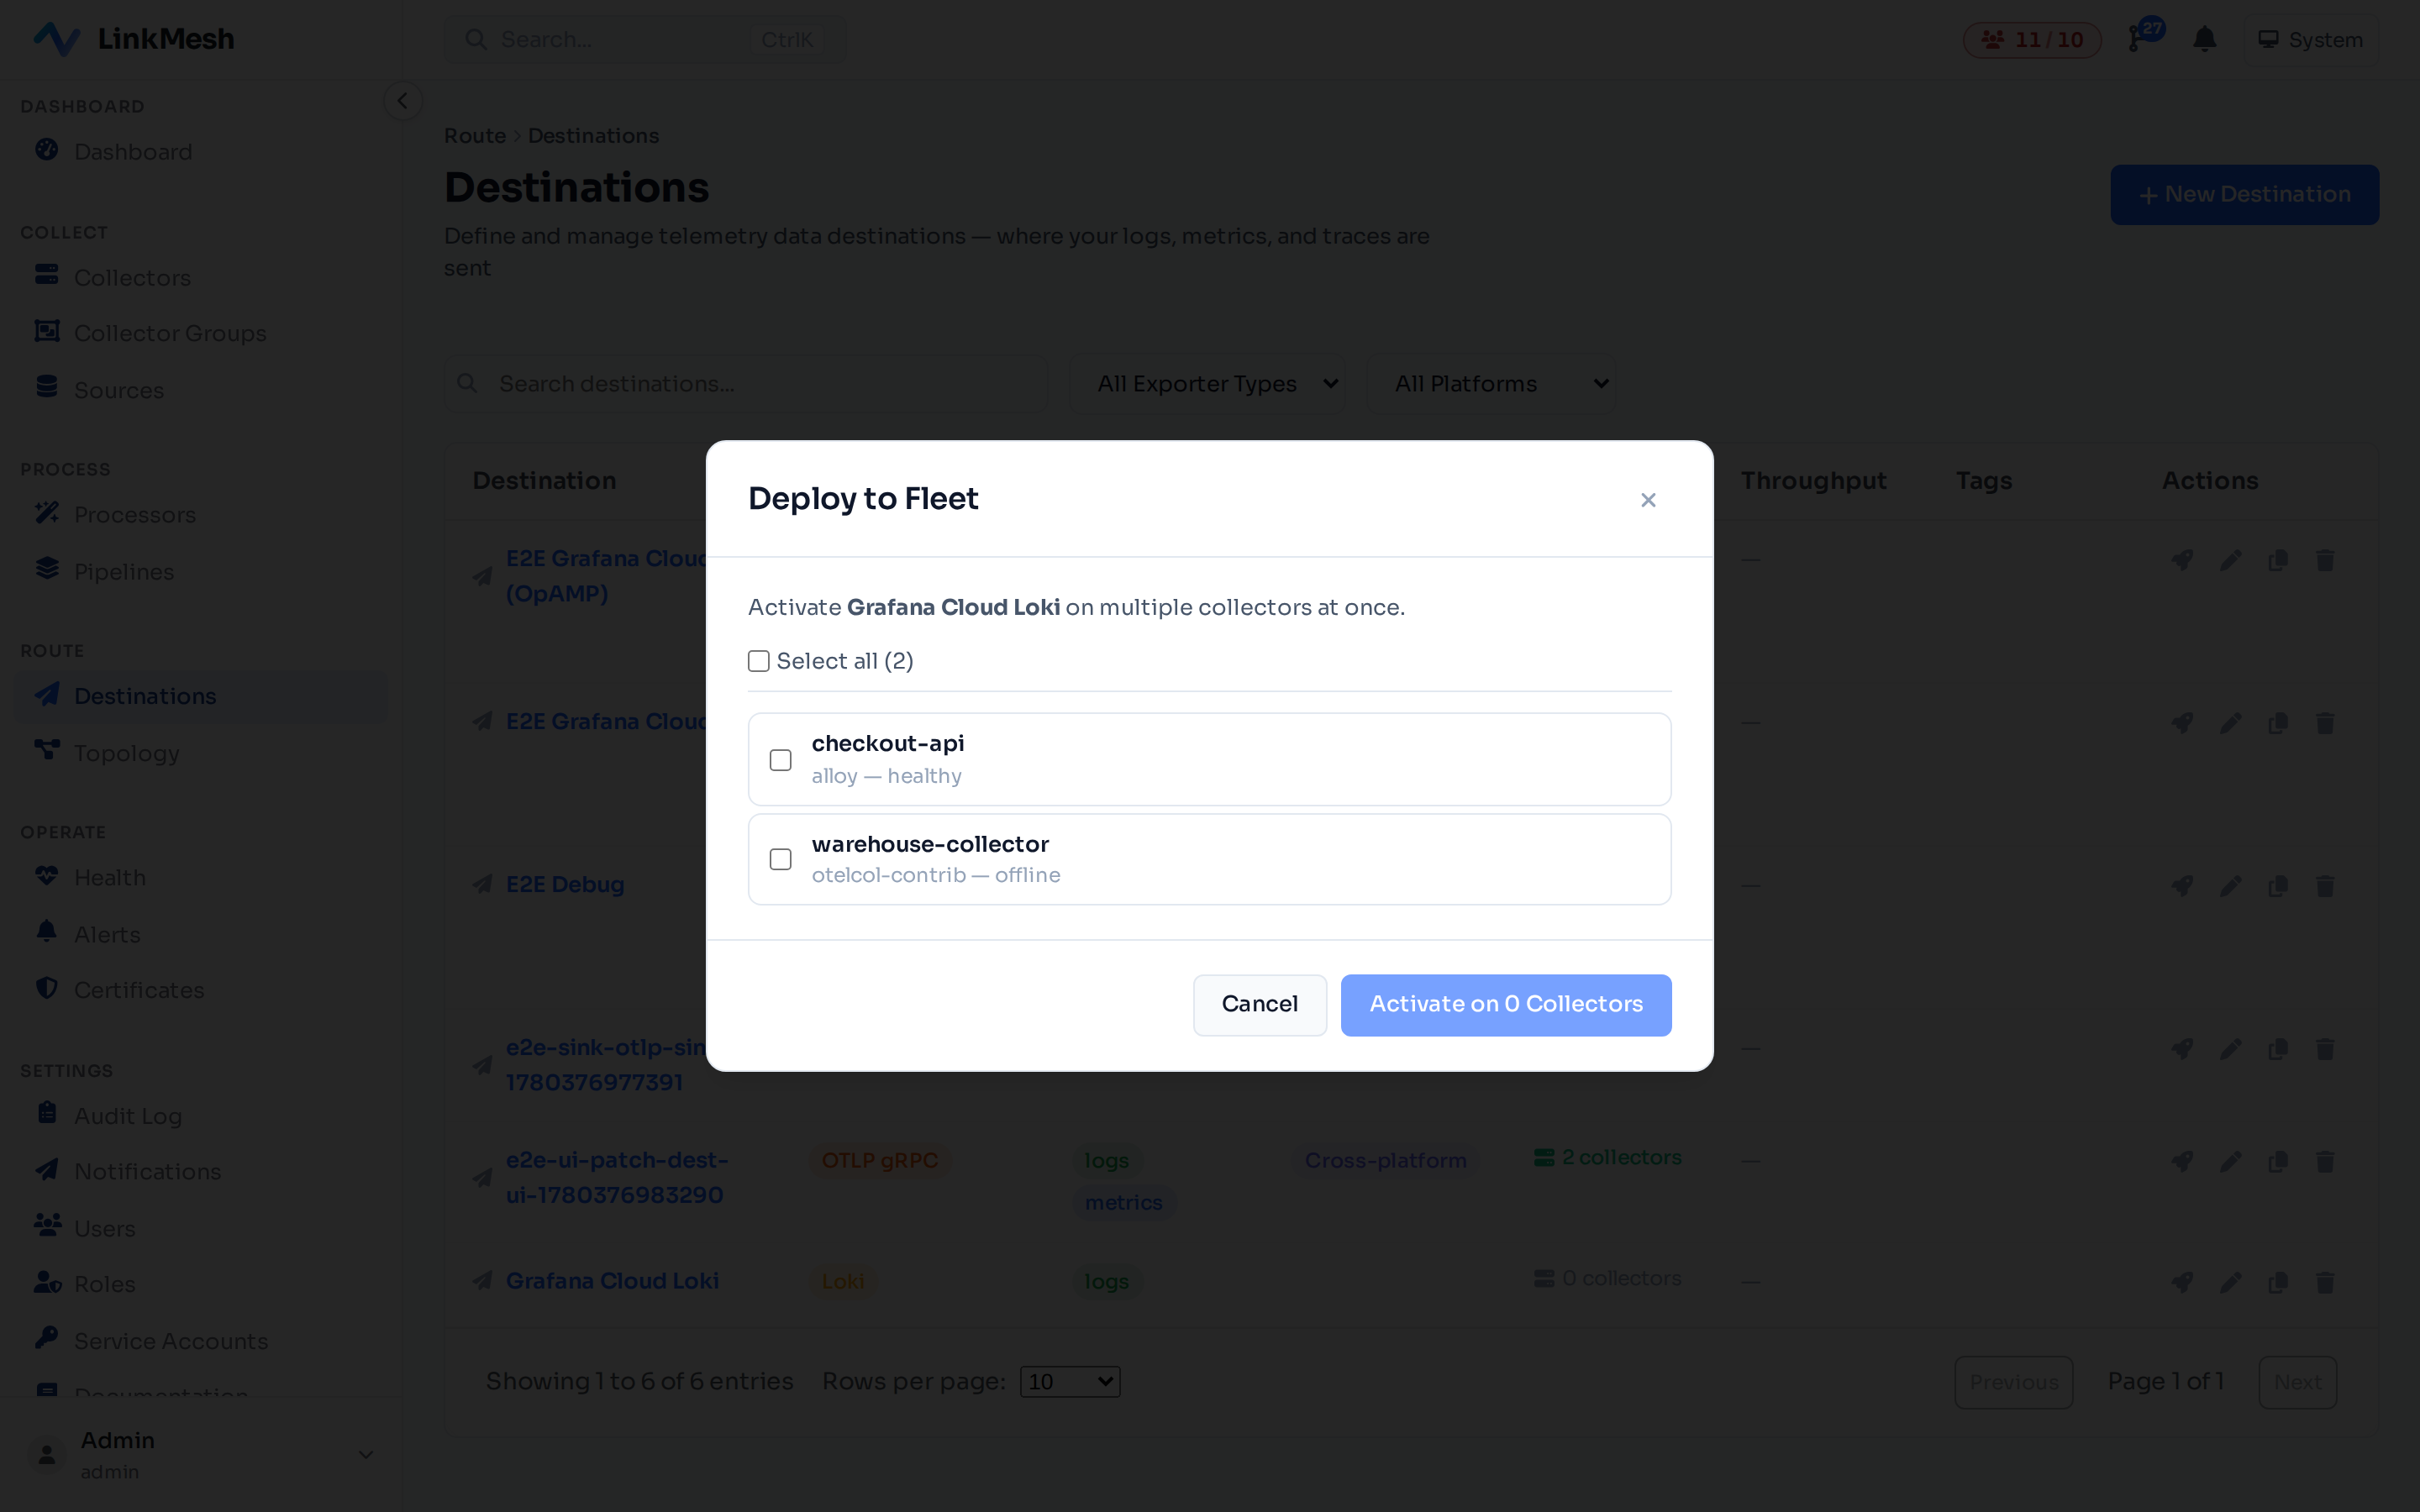
The result
You cut volume at the source, keep the signal that matters, stop shipping data you're liable for, and your bill follows the volume down. No vendor lock-in. No flying blind. Just the telemetry you actually use, going where it belongs.
And our pricing won't punish you for scaling
Here's the part that catches people off guard: the tools meant to help you control observability cost almost always bill you the same way your backend does — by data volume. The more telemetry you run through them, the more they charge. That's the same trap, one layer up.
LinkMesh is priced per collector, with a cap — not per byte. Your bill is predictable, it doesn't spike when traffic does, and doing the right thing (shaping your telemetry down) is never penalized. You save at the backend and on the control plane — and your cost stops climbing as you grow.
LinkMesh is in early access — try it today
LinkMesh is in early access as of today. It's self-hosted, so you can download and run it yourself — no demo, no sales call. If your observability bill has outgrown its usefulness, or you're tired of hand-managing a fleet of collectors, grab it at linkmesh.io and read the docs at docs.linkmesh.io.
We're also opening a small founding cohort: 8–12 teams, free, with no usage limits, in exchange for honest feedback and a hand in shaping the roadmap — bonus points if you're running 20+ collectors. If that's you, reach out to claim a founding spot.
We're building this in the open, fast, and being early access, it'll only get better with your feedback.